Universidade de Aveiro 2015
|
|
|
- Rayssa Lima César
- 6 Há anos
- Visualizações:
Transcrição
1 Universidade de Aveiro 2015 Secção Autónoma de Ciências da Saúde Ana Brígida Francisco Patrício Impacto das alterações da comunicação na qualidade de vida das pessoas com afasia e na dos seus cuidadores The impact of communication disability on quality of life of people with aphasia and their caregivers
2
3 Universidade de Aveiro Secção Autónoma de Ciências da Saúde 2015 Ana Brígida Francisco Patrício Impacto das alterações da comunicação na qualide de vida das pessoas com afasia e na dos seus cuidadores The impact of communication disability on quality of life of people with aphasia and their caregivers Dissertação apresentada à Universidade de Aveiro para cumprimento dos requisitos necessários à obtenção do grau de Doutor em Ciências e Tecnologias da Saúde, realizada sob a orientação científica do Doutor Luís Miguel Teixeira de Jesus, Professor Coordenador na Universidade de Aveiro e co-orientação científica da Dr. Madeline Cruice, Senior Lecturer na City University London, UK. Apoio financeiro do Programa de Formação Avançada de Docentes do Ensino Superior do Instituto Politécnico do Porto
4 .
5 Dedico este estudo às pessoas com afasia, seus cuidadores e a todos os profissionais que trabalham para melhorar a qualidade de vida destas pessoas.
6
7 o júri Presidente Prof. Doutor Valeri Skliarov Professor Catedrático da Universidade de Aveiro Prof. Doutor Alexandre Castro Caldas Professor Catedrático da Universidade Católica Portuguesa Prof. Doutor José Augusto Simões Gonçalves Leitão Professor Auxiliar da Faculdade de Psicologia e Ciências da Educação da Universidade de Coimbra Prof. Doutora Andreia Oliveira Hall Professora Associada da Universidade de Aveiro Prof. Doutora Anabela Correia Martins Professora Adjunta da Escola Superior de Tecnologia da Saúde de Coimbra Prof. Doutor Luís Miguel Teixeira de Jesus Professor Coordenador da Universidade de Aveiro
8
9 Agradecimentos Quero manifestar o meu profundo agradecimento ao meu orientador, Prof. Doutor Luís Miguel Teixeira de Jesus, e à minha co-orientadora, Dr. Madeline Cruice, pela partilha de saberes, pelo rigor e exigência, pela disponibilidade, encorajamento, dedicação, compreensão, paciência e amabilidade. Só com a vossa orientação consegui chegar aqui. Obrigada pela preciosa ajuda. Os meus sinceros agradecimentos também à Prof. Doutora Andreia Hall pela valiosa ajuda ao nível da estatística. Sem esta ajuda tudo teria sido mais difícil. Um agradecimento muito especial a todos os participantes neste estudo. A vossa participação foi essencial para que este projecto se concretizasse. Um sentido agradecimento às instituições e aos terapeutas da fala que colaboraram neste estudo pela sua disponibilidade, dedicação e cooperação. Devo também um agradecimento a todas as pessoas com afasia e cuidadores com quem trabalhei ao longo da minha vida profissional. Estas pessoas são a minha fonte de inspiração. O meu agradecimento também ao Instituto de Engenharia Eletrónica e Informática de Aveiro (IEETA), Universidade de Aveiro, por todo o apoio técnico. O meu sentido agradecimento à minha querida e amada família pelo amor e apoio constantes durante toda a minha vida. Com a família todo se torna mais fácil, tudo se completa e tudo faz mais sentido. Agradeço também ao Instituto Politécnico do Porto pelo apoio através do Programa de Programa de Formação Avançada de Docentes do Ensino Superior.
10
11 palavras-chave Perturbação da comunicação, afasia, cuidadores, qualidade de vida, relações sociais resumo A afasia é uma perturbação da comunicação adquirida, de caráter crónico, que pode alterar a vida das pessoas com afasia (PCA) e a dos seus cuidadores de forma significativa. Ambos referem frequentemente mudanças a nível social e emocional, contudo, o impacto que estas mudanças têm na qualidade de vida (QV) necessita de mais investigação. Este estudo identifica preditores e variáveis que influenciam a QV e as relações sociais (RS) das PCA e dos seus cuidadores. É um estudo transversal descritivo, correlacional e comparativo que incluiu uma amostra de 255 indivíduos da população portuguesa em geral (43 anos de idade média e amplitude anos; 148 mulheres e 107 homens), 25 PCA (54 anos de idade média e amplitude de anos; 12 mulheres e 13 homens), e 25 cuidadores (idade média de 51 anos e amplitude de anos; 17 mulheres e 8 homens). Todos os participantes responderam ao questionário World Health Organization Quality of Life Bref, ao domínio das RS do World Health Organization Quality of Life 100 e ao Center for Epidemiologic Studies Depression Scale. Aos participantes com afasia foi ainda administrada a Bateria de Avaliação de Afasia de Lisboa, o Barthel Index, o Frenchay Activities Index, o Communication Disability Profile e o Mini-Mental State Modificado que avaliaram a linguagem, o coeficiente de afasia, as atividades, a participação e a cognição. Adicionalmente, os cuidadores completaram o Carers Assessment of Managing Index que avalia as estratégias de coping utilizadas. As PCA e os seus cuidadores estão menos satisfeitos com a sua QV e RS que as pessoas da população em geral, sendo que as PCA são as que apresentam pior QV e RS. A afasia parece, portanto, ter um impacto negativo na QV e nas RS das PCA. O estado emocional é muito importante para a QV e para as RS dos três grupos. As atividades e participação das PCA têm grande influência na QV e nas RS das PCA e dos cuidadores. Adicionalmente, o estado emocional e a participação são os melhores preditores da QV das PCA e a participação o melhor preditor das RS. O estado emocional, participação e atividades da PCA são os melhores preditores da QV dos cuidadores; o estado emocional e o número de coabitantes os melhores preditores das RS dos cuidadores. A avaliação e intervenção com PCA deve contemplar todos os aspectos que influenciam a QV e RS das PCA e dos seus cuidadores para que o objectivo de melhorar a sua QV e RS seja atingido. Estes resultados são importantes para identificar e planear o apoio necessário, são úteis na orientação dos serviços prestados pelas instituições e permitem o ajuste dos programas e políticas de saúde às reais necessidades destas pessoas.
12
13 keywords Communication disability, aphasia, caregivers, quality of life, social relationships abstract Aphasia is a chronic acquired communication disorder that may change people with aphasia (PWA) and their caregivers lives for ever. Social and emotional changes are frequently reported by both, although the impact of these changes in quality of life (QOL) needs further research. This study identifies predictors and variables that influence PWA s and their caregivers QOL and social relationships (SR). A cross-sectional descriptive, correlational and comparative study was undertaken with 255 individuals from Portuguese general population (mean age 43 years, range years; 148 females, 107 males), 25 PWA (mean age 54 years, range 20-71; 12 females and 13 males), and 25 caregivers (mean age 51 years, range 26-73; 17 females and 8 males). All the participants completed the World Health Quality of Life Bref instrument, the SR domain of the World Health Organization Quality of Life 100 scale, and the Center for Epidemiologic Studies Depression Scale. Participants with aphasia completed the Lisbon Aphasia Assessment Battery, Barthel Index, Frenchay Activities Index, Communication Disability Profile and the Modified Mini- Mental State which evaluated language disability, aphasia coefficient, activities, participation and cognition. In addition, caregivers completed the Carers Assessment of Managing Index to assess coping strategies. PWA and their caregivers are less satisfied with their QOL and SR than Portuguese general population; whereas PWA have the worse QOL and SR. Thus, aphasia seems to impact negatively in their QOL and SR. Emotional status has great importance for QOL and SR among the three groups. PWA s activities and participation have great impact in both PWA s and caregivers QOL and SR. Additionally, emotional status and participation are the best predictors of PWA s QOL. Along with these two variables, activities of the PWA are the best predictors of caregivers QOL. Participation is the best predictor of PWA s SR; emotional status and number of cohabitants are best predictors for caregivers SR. Aphasia assessment and intervention should take into account all the factors that influence PWA s and caregivers QOL and SR so the central goal of enhancing it can be achieved. These results are important for identifying and planning support needs and are useful in the orientation of the activities carried out by the service providers allowing the adjustment of health programs and policies based on people s real life needs.
14
15 INDEX CHAPTER 1: Introduction CHAPTER 2: Literature review Quality of life definition Quality of life assessment Quality of life instruments World Health Organization quality of life instruments Stroke specific quality of life assessment People s with aphasia quality of life assessment Quality of life of general population Quality of life of people with stroke Quality of life of people with aphasia Quality of life of the caregivers of people with stroke and post-stroke aphasia. 59 CHAPTER 3: Aims and Method Aims of the study Method Study 1 (Portuguese general population sample) Study design and sample characteristics Measures Ethical and sampling procedures Statistical Analysis Study 2 and study 3 (PWA and caregivers samples) Study design and sample characteristics Measures Ethical and sampling procedures Statistical Analysis CHAPTER 4: Results Study 1 (Portuguese general population sample) Study 2 (People with aphasia sample) Study 3 (Caregivers sample) CHAPTER 5: Discussion Quality of life of general population Social relationships of general population
16 5.3. Quality of life of people with aphasia Social relationships of people with aphasia Quality of life of the caregivers Social relationships of the caregivers CHAPTER 6: Study limitations, future work and conclusions Study limitations and future work Conclusions REFERENCES Author s relevant publications APPENDIXES Appendix A: World Health Organization Quality of Life Scale - Bref (WHOQOL-Bref) Appendix B: World Health Organization Quality of Life Scale 100 (WHOQOL-100) Social Relationships domain Appendix C: Center for Epidemiologic Studies Depression Scale (CES-D) Appendix D: Sociodemogaphic datasheet for Portuguese general population Appendix E: Ethics committee authorization for Portuguese general population s study Appendix F: Study information (Portuguese general population) Appendix G: Frenchay Activities Index (FAI) Appendix H: Barthel Index (BI) Appendix I: Mini-mental State Modificado (MMSM) Appendix J: Communication Disability Profile (CDP) Appendix K: Lisbon Aphasia Assessment Battery (LAAB) Appendix L: Carers Assessment of Managing Index Appendix M: Sociodemographic datasheet for PWA Appendix N: Sociodemographic datasheet for the caregivers Appendix O: Assessment of the usability of WHOQOL-Bref with PWA Appendix P: Ethical approval from institutions to collect data from PWA and their caregivers Appendix Q: Cover letter for speech and language therapists Appendix R: Procedures information Appendix S: General instructions for instruments appliance Appendix T: Study information for PWA Appendix U: Study information for the caregivers Appendix V: Informed consent for PWA Appendix W: Informed consent for the caregivers Appendix X: Table results for study 1 (Portuguese general population sample) Appendix Y: Table results for study 2 (People with aphasia sample) Appendix Z: Table results for study 3 (Caregivers sample)
17 INDEX OF TABLES Table 1: Sample characteristics of stroke QOL studies Table 1: Sample characteristics of stroke QOL studies (continued) Table 2: Aims and main findings of the stroke QOL studies Table 2: Aims and main findings of the stroke QOL studies (continued) Table 2: Aims and main findings of the stroke QOL studies (continued) Table 2: Aims and main findings of the stroke QOL studies (continued) Table 3: Sample characteristics of PWA QOL studies Table 3: Sample characteristics of PWA QOL studies (continued) Table 4: Aims, methodology and main findings of PWA QOL studies Table 5: Sample characteristics of PWA s caregivers QOL studies Table 6: Studies aims, methodology and main findings Table 7: Sample size for minimum effect sizes and high test power Table 8: Effect size for a sample of 255 and high test power Table 9: Demographic data (N=255) Table 10: Regional distribution (N=255) Table 10: Regional distribution (N=255) (continued) Table 11: Overall QOL and domains means Table 12: Kruskal-Wallis test results for overall QOL and living place, marital status, type of cohabitants, occupation and health Table 13: Overall QOL and domains descriptive data Table 14: QOL domains as predictors of overall QOL Table 15: Demographic predictors of overall QOL Table 16: SR domains correlations Table 18: SR WHOQOL-100 domain total score and its items correlation Table 19: PWA sociodemographic data (N=25) Table 19: PWA sociodemographic data (N=25) (continued) Table 20: PWA stroke and aphasia data Table 21: Overall QOL and domains means for PWA Table 22: PWA overall QOL correlations with QOL domains (WHOQOL-Bref) Table 23: PWA overall QOL correlations with age, educational level, socioeconomic status, number of people living with and emotional status Table 24: PWA correlations of overall QOL with: time post-stroke, aphasia coefficient, activities (BI, FAI and CDP), participation (CDP) and cognition (MMSM) Table 25: PWA correlations of overall SR domains (WHOQOL-Bref and WHOQOL-100) and: time post-stroke, emotional status, aphasia coefficient, activities (BI, FAI and CDP), participation and cognition Table 26: Descriptive statistics of the control group and PWA group Table 27: Mann-Whitney test results for overall QOL and SR comparison between groups (control and PWA) Table 28: Descriptive statistics for overall QOL, and SR domain
18 Table 29: Speech and language therapists experience with WHOQOL-Bref Table 30: Caregivers' sociodemographic data Table 30: Caregivers' sociodemographic data (continued) Table 31: Overall QOL and domains means for caregivers Table 32: Caregivers overall QOL correlations with age, educational level, socioeconomic status, number of people living with, emotional status and coping Table 33: Caregivers' overall QOL predictors Table 34: SR domains correlations with age, educational level, socioeconomic status, and number of people living with for caregivers group Table 35: SR domains correlations with age, educational level, socioeconomic status, and number of people living with for caregivers group Table 36: SR WHOQOL-100 items correlations for caregivers' group Table 37: Descriptive statistics of the control group and caregivers' group Table 38: Descriptive statistics for overall QOL, and SR domain for caregivers and its control group Table 39: Descriptive statistics of the PWA s and caregivers' group Table 40: Descriptive statistics for overall QOL, and SR domain for PWA and caregivers Table X.1: Overall QOL and QOL domains correlations (WHOQOL-Bref) Table X.2: Overall QOL and WHOQOL-100 SR domain correlation Table X.3: Correlations between overall QOL and Age, Educational level, Socieconomic status, Number of cohabitants and Emotional status Table X.4: Chi-Square for QOL and Gender Table X.5: Linear regression for SR domain (WHOQOL-Bref) Table X.6: SR domains as predictors of overall QOL Table X.7: SR domain of WHOQOL-Bref and its items correlation Table X.8: SR WHOQOL-Bref items predictors for SR results Table X.9: WHOQOL-100 SR items as predictors of overall WHOQOL-100 SR Table Y.1: PWA s overall QOL correlation with WHOQOL-100 SR domain Table Y.2: Kruskal Wallis for Overall QOL and gender, marital status, type of cohabitants, occupation and health (PCA) Table Y.3: QOL correlations with time after discharge, SLT time and the time PWA's left SLT Table Y.4: Kruskal-Wallis for Overall QOL and motor impairment, aphasia etiology and having SLT currently or in the past Table Y.5: QOL domains as PWA s overall QOL predictors Table Y.6: SR domains (WHOQOL-Bref and WHOQOL-100) as PWA s overall QOL predictors Table Y.7: PWA s overall QOL predictors Table Y.8: Correlation between PWA's SR domains and age, educational level, socioeconomic status and number of cohabitants Table Y.9: Correlation between PWA's SR domains and time after discharge, SLT time and time PWA's left SLT Table Y.10: Kruskal-Wallis for Overall SR and Age, marital status, type of cohabitants, occupation, health, motor impairment, aphasia etiology and SLT currently or in the past (PWA) Table Y.11: PWA s SR predictors
19 Table Y.12: SR WHOQOL-Bref items correlations for PWA s group Table Y.13: SR WHOQOL-100 items correlations for PWA s group Table Y.14: WHOQOL-Bref SR items as predictor of PWA s SR results Table Y.15: WHOQOL-100 SR items as predictors of PWA s SR results Table Y.16: Independent Samples t test for equality of groups' ages (control and PWA) Table Y.17: Mann-Whitney for educational level comparison between groups (control and PWA) Table Z.1: Caregivers overall QOL correlations with QOL domains (WHOQOL-Bref) Table Z.2: Caregivers overall QOL correlation with WHOQOL-100 SR domain Table Z.3: The use of coping strategies - CAMI's items frequencies Table Z.4: Kruskal Wallis for overall QOL and gender, marital status, type of cohabitants, occupation and health (Caregivers) Table Z.5: Correlation between QOL and Time post-stroke, Aphasia severity, activities (BI, FAI and CDP), participation and cognition Table Z.6: Correlation between caregivers' QOL and time after discharge, SLT time and time PWA's left SLT Table Z.7: Kruskal Wallis for caregivers' QOL and motor impairment, aphasia etiology and PWA's having SLT currently or in the past Table Z.8: QOL domains as predictors of caregivers overall QOL Table Z.9: SR domains (WHOQOL-Bref and WHOQOL-100) as caregivers' overall QOL predictors Table Z.10: Correlations between caregivers' SR domains and time after discharge, SLT time and the time PWA left SLT Table Z.11: Kruskal-Wallis for SR and gender, marital status, type of cohabitants, occupation, health, motor impairment, aphasia etiology, and STL currently or in the past (Caregivers) Table Z.12: Caregivers' SR predictors Table Z.13: SR WHOQOL-Bref items correlations for caregivers' group Table Z.14: Table: WHOQOL-Bref SR items as predictor of caregivers SR results Table Z.15: WHOQOL-100f SR items as predictor of caregivers' SR results Table Z.16: Independent Samples t test for equality of groups' ages (control and caregivers) Table Z.17: Mann-Whitney for educational level comparison between groups (control and caregivers) Table Z.18: Mann-Whitney for overall QOL and SR comparison between groups (control and caregivers) Table Z.19: Independent Samples t test for equality of groups' ages (PWA and caregivers) Table Z.20: Mann-Whitney for educational level comparison between groups (PWA and caregivers) Table Z.21: Mann-Whitney for overall QOL and SR comparison between groups (PWA and caregivers)
20
21 List of abbreviations ADL Activities of daily living BI Barthel Index CAMI Carer s Assessment of Managing Index CDP Communication Disability Profile CES-D Center for Epidemiologic Studies Depression Scale EQ-5D EuroQol ESOMAR - European Society for Social, Opinion and Market Research FAI Frenchay Activities Index HRQOL Health Related Quality of Life LAAB Lisbon Aphasia Assessment Battery LMMS Language Modified Mini-Mental State MMSE Mini Mental State Examination MMSM Mini-Mental State Modificado NHP Nottingham Health Profile PCA Pessoa(s) com afasia PWA People/person with aphasia PWI Psychosocial Well-Being Index QCL Quality of Communication Life Scale QLI Quality of Life Index QOL Quality of life QV Qualidade de vida RS Relações sociais SAQOL Stroke Aphasic Quality of Life Scale SA-SIP-30 - Stroke Adapted 30-Item Version of the Sickness Impact Profile SF-20 Medical Outcome Study Short-Form General Health Survey SF-36 Short-Form General Health Survey-36 SLT Speech and language therapy SR Social relationships SS-QOL Stroke Specific Quality of Life Scale SWB Subjective Well-Being WHO World Health Organization WHOQOL World Health Organization Quality of Life WHOQOL-100 World health Organization Quality of Life Scale WHOQOL-Bref World health Organization Quality of Life Scale Bref
22
23 Introduction CHAPTER 1: Introduction Aphasia is an acquired language disability caused by brain damage, usually stroke, that affects the person s ability to communicate with others since it may compromise speaking, understanding, reading, and writing (Goodglass, 1993; Hallowell & Chapey, 2008). Aphasia affects the biopsychosocial integrity of the individuals compromising their social relationships (SR), their participation in activities, their emotional status and their QOL. These changes are unexpected and also have impact on the family and other social partners. Usually families report social and emotional changes and various difficulties communicating with the people with aphasia (PWA) (K. Brown, Worrall, Davidson, & Howe, 2011; Grawburg, Howe, Worrall, & Scarinci, 2013a, 2013b; Kitzmuller, Asplund, & Haggstrom, 2012). The extent of the impact of aphasia may be different across people, although it usually impacts in life domains and affects people s QOL. Adjustment is needed from PWA, their families, caregivers, and surrounding community. Comprehensive aphasia treatment should include aims embracing PWA and their families learning about and adjusting to aphasia. Communication skills training, activities and life participation oriented interventions, counselling and support should be included in those treatments. Therefore, their needs and rehabilitation goals need to be identified, and gathering more data about the impact of this pathology in their lives can help to achieve that in a more comprehensive manner. A better understanding of how this condition affects PWA s and their caregivers QOL allows clinicians to target more specific interventions, and to develop programs for successful reintegration of these people in their community. This can also be an effective way of enhancing communication within family and provide PWA with a caring context for improving communication skills. According to social approaches, the aim of any intervention is to enhance QOL. Clinicians usually believe that their treatment will improve PWA and their families and caregivers QOL, however, a systematic measurement of QOL is needed to validate such a claim (Cranfill & Wright, 2010). Without this assessment, treatments may be considered successful despite poor psychosocial functioning or adjustment to the new life situation. Impairment-based assessments frequently contemplate language disorders, providing no information about the impact of the communication disability and treatment in patient s lives (Ross & Wertz, 2003). To achieve that, beyond the traditional assessments and interventions, more comprehensive assessments and interventions including social components are needed. The consequences of aphasia are relatively well known, though the impact on their QOL has been less explored especially regarding PWA s caregivers. Moreover, despite the amount of Brígida Patrício 23
24 Introduction research regarding the effect of stroke in QOL, most studies have excluded PWA, since their language and communication problems restrict their participation in QOL assessment. To fill this gap, many efforts have been undertaken in the last decade to study PWA s QOL, but only few studies report on the significance of the impact of language and communication disability in QOL. In Portugal, little information is available about PWA s QOL (Rodrigues & Leal, 2013) and none is published yet about their caregivers QOL, so more research is needed to gain an empirically based understanding. Furthermore, to better understand the meaning of QOL scores, it is important to have population-based normative values (Wahl, Rustøen, Hanestad, Lerdal, & Moum, 2004). Since the normative values for Portuguese general population available are limited, our study began by collecting data from this population. Then, data was collected from PWA and their caregivers. The three groups were characterised regarding QOL and SR (since SR is a variable of concern in aphasia) and the results compared in order to study the impact of the communication disability in PWA and their caregivers QOL. Correlated and predictive variables were identified. Brígida Patrício 24
25 Literature review CHAPTER 2: Literature review 2.1. Quality of life definition Philosophers such as Plato and Aristotle were the first to discuss concepts related to QOL such as well-being, satisfaction and happiness (K. Anderson & Burckhardt, 1999; Martins, 2006). However, it was only after the Second World War that the concept of QOL became most widely used. First, it was applied when refering to material goods but in the 60 s politicians began to use it to describe psychossocial satisfation and well-being (Martins, 2006; Pimentel, 2006). For instance, Cantril (1963) reported that in 1958 the major concerns of Americans were maintaining a satisfatory health and family life, a decent standard of living, housing and leisure as well as maintaining peace, continuing employment, working conditions, being accepted and having modern conveniences (Cantril, 1963). Later on Dalkey et al. (1972) identified different relevant categories for QOL: love; affection; self-respect and self-satisfaction; peace of mind; sexual satisfaction; stimulation and challenge; social acceptance; general achievement and job satisfaction; individuality; involvement and participation; comfort; economic well-being and good health; novelty and change: dominance; superiority; independence and privacy (Dalkey, Rourke, Lewis, & Snyder, 1972). Through the years the population became more demanding and began to have broader goals related to life, happiness and well-being. The 80 s positive psychology movement concerns about positive experiences of human existence had a great impact on organisations, and the client and patient satisfation became a crucial point to take into account in the strategical plan of the organisations (Claes, Hove, Loon, Vandevelde, & Schalok, 2010; Fleck, 2008). Also, the social indicators evolved, and currently the United Nations Development Programme encompasses social and education issues and is concerned with the impact of social and economic decision on the wellbeing of families and not merely with traditional economic indicators such as the incomes per capita (Fleck, 2008; WGISPC, 1996). Likewise, some changes happened in health. In 1948 WHO s definition of health covered domains such as physical, mental and social well-being and not simply the absence of disease (Fayers & Machin, 2007; Pimentel, 2006). The need to humanise health services increased and the relationship between the professional and the patient became more and more important and nowadays is recognised as having a large impact in treatment success (Fleck, 2008). All these issues influenced the concept of QOL. It evolved from a material and biological point of Brígida Patrício 25
26 Literature review view to aspects related to personal care, human rights, daily and social life as well as health issues (Martins, 2006). According to Bowling s (1995) survey, the term QOL was only introduced by Medline as a heading in 1975 but a great interest in the subject in the medical literature started in There has been a proliferation of study groups, conferences, special journal issues and journals interested in general QOL such as the Quality of Life Research Journal (Bowling, 2001). According to O Boyle (1997) there were only eight publications in which the term QOL was mentioned in Medline in 1974, but in 1996 the number increased to 1482 (O Boyle, 1997). In 2005 there were about citations (Moreno, Faerstein, Werneck, Lopes, & Chor, 2006). Quality of Life is a multidimensional, and holistic construct that theoretically incorporates all aspects of an individual s life (Bowling, 2001; Pimentel, 2006). Its study has a longer tradition in the social and related sciences, although, currently, QOL is often used in many different fields for many different purposes. Since it is a broad and subjective concept, each discipline has promoted the development of different points of view of how QOL should be conceptualised and measured (Claes et al., 2010; Pimentel, 2006). For example, social scientists included factors such as socio-economic status, financial concerns, personal goals, employment and social support and, in some conceptualisations, spirituality, meaningfulness and beliefs are also included. Healthcare economists are concerned about resources allocation for the achievement of different goals focusing, for example, on cost-benefit relation. Health professionals devote great attention to illness and related variables, and more recently to functionality and social participation. The difficulty of identifying the components of QOL in both general population and in specific groups has also led to some problems in terms of defining the QOL concept (Holmes, 2005). To distinguish between QOL in such a general sense and the requirements of medicine and clinical trials, the concept of Health Related Quality of Life (HRQOL) emerged, concerned with the impact of a medical condition or treatment in one s physical, emotional and social well-being (Celia & Bonini, 1995; Fayers & Machin, 2007; Khanna & Tsevat, 2007) Quality of life has been considered and defined in different ways which shows the difficulty in achieving an agreed meaning (Fayers & Machin, 2007; Phillips, 2006) and explains why it can be interpreted differently according to the discipline (Claes et al., 2010; Holmes, 2005; Phillips, 2006). As a result, there is more than one definition of QOL, and a large number of instruments to measure it (Claes et al., 2010; Pimentel, 2006). It is currently accepted that the meaning of QOL should include all the significant areas that allow people to achieve their goals and to satisfy their needs at different levels; having the same Brígida Patrício 26
27 Literature review basic components for all people (Cummins, 2005; Fleck, 2008; Sorin-Peters, 2003; WHO, 1998). Thus, some common concepts and ideas about QOL emerged: it is subjective, since it is related to self-perception about one s performance (and should be enhanced by self-determination); and is multidimensional, i.e., comprehends various domains, including all the significant areas of life (physical functions and health, psychological status, level of independence, social relationships, relationship with environment, personal beliefs and spirituality) (Fleck, 2008; Sorin-Peters, 2003; WHO, 1998). The idea that basic components of QOL are the same to everyone suggests that there is an identifiable set of core domains common to all people, although they may vary in relative value and importance (Claes et al., 2010; Cummins, 2005). Individual variation exists because QOL depends on the fulfilment of life experience (Cummins, 2005; Fleck, 2008; Pimentel, 2006), but there are some basic common aspects (Cummins, 2005). It is important to study the common set of core domains but it is also important to study the variations according to certain variables. Despite the diversity of definitions, that proposed by the World Health Organization (WHO) has gained greater consensus (Fleck, 2008; Worrall & Hickson, 2003). According to the WHO (1998), QOL is defined as the individual s perceptions of their position in life in the context of the culture and value system where they live, and in relation to their goals, expectations, standards and concerns. Subjects such as health, environment, family, work and culture are encompassed in QOL (WHO, 1998). In this study we will follow this QOL definition, which emphasises perceptions, and multiple dimensions and also reflects a complex, and integrative view of QOL (Gill et al., 2010). Brígida Patrício 27
28 Literature review 2.2. Quality of life assessment Quality of life is important for everyone and during a period of time it was believed that scientific, medical and technological advances would, by themselves, improve QOL (Verdugo, Schalock, Keith, & Stancliffe, 2005). For a long period of time science studied only the dark side of life, the disability, influenced by approaches such as the behaviourism in which anything subjective and not objectively observable was judged as unscientific (Lenderking, 2005). Currently it is accepted that life is influenced by complex combinations of the advances mentioned above, values, environment, expectations and perceptions (Verdugo et al., 2005; WHO, 1997). Furthermore, the increasing consumer empowerment and the emphasis in person-centred planning, contributed in large scale to increase the interest in studying QOL (Verdugo et al., 2005). In health, part of the development of research related to QOL results from concerns about health efficacy, efficiency or other economic concerns, but with the development of medicine and the increasing life expectancy, survival per se is no longer perceived as the main point of health, the goal is to enhance, restore or preserve QOL. Increasingly influenced by the ecological and social models, disability is progressively seen as part of the society and thus should be accommodated by it. Concerns about the impact of disability in individuals and their family increased and, thus, treating a disease in a pure biomedical framework is now widely recognised as insufficient (R. I. Brown, Schalock, & Brown, 2009; Fleck, 2008; Khanna & Tsevat, 2007; Moreno et al., 2006; Serra et al., 2006; Singh & Dixit, 2010). Such perspective influenced scientists to view all people as having the right to live with quality and that a key support goal is to enhance the QOL of the people and their families (R. I. Brown et al., 2009). Progressively more health care planners consider that assessing how people live their lives is crucial, recognising that measures of disease alone are insufficient determinants of health and life status, especially when it comes to chronic diseases, in which the main goal is to enhance functionality, to reduce the impact of the disability in the various areas of their lives, to maintain or to improve QOL (Fleck, 2008; Khanna & Tsevat, 2007) Quality of life instruments As QOL is a broad and subjective concept many instruments have been used to assess it, so there is no ideal measure, but some more suitable for a particular purpose (Cruice, Hirsch, Worrall, Holland, & Hickson, 2000; Cruice, Worrall, & Hickson, 2000; Opara & Jaracz, 2010; Skevington, Lofty, & O'Connel, 2004). The use of objective and subjective methodologies may be important, nevertheless, there has been a preference for objective over subjective methods, thus reproducible Brígida Patrício 28
29 Literature review data and standardised QOL instruments have been used more often (Cruice, Hirsch, et al., 2000; Cruice, Worrall, et al., 2000). QOL instruments are conceptualised through a factor, facets and indicators structure (Claes et al., 2010; Cummins, 2005; Verdugo et al., 2005; WHO, 1997). The term factor is used to designate the higher order construct of QOL and is equivalent to the term domain (e.g., psychosocial). Quality of Life domains are the set of factors that define the multidimensionality of QOL (Claes et al., 2010; Cummins, 2005). The WHO (WHO, 1997) identified six main domains which describe core aspects of QOL cross-culturally: physical; psychosocial; level of independence; social relationships (SR); environment; and personal beliefs/spirituality. The WHO uses the facet concept which includes items of the same domain but dividing them in small subgroups of the same subject. For example, the SR domain of one WHO instrument has three facets: satisfaction with SR with others; support received from others; and sexual life (CPRO, 2007). Indicators are the perceptions, behaviours or conditions that define each domain, giving an indication of the person s well-being (e.g., social networks that characterise interpersonal relationships) (Claes et al., 2010; Verdugo et al., 2005). Indicators are sensitive to cultural and linguistic differences, and indicate variation and potential for improvement of outcomes (Verdugo et al., 2005). Indicators are items used to evaluate individual outcomes based on perceived well-being (self-report) or an objective indicator of the person s life experience based on direct observation (Claes et al., 2010). Regarding health, there has been an on-going interest in developing patient-centred instruments that assess functional status and QOL (Fleck, 2008; Khanna & Tsevat, 2007; Patrick, 2008; Skevington et al., 2004; L. Williams, Weinberger, Harris, Clark, & Biller, 1999). The proliferation of measurement instruments reflects, in part at least, an increasing pressure to demonstrate the effectiveness of care and treatment and increasing consensus around the need to establish the effects of given illness or treatment on the patient s life and to incorporate the patient s perspective in evaluating interventions (Holmes, 2005). Consequently, there has been a multiplication of QOL measures, many of which were not based on a conceptual framework or lack cross-cultural equivalence (Canavarro et al., 2009). Quality of life measures need to be robustly designed, tested and validated in order to be used. Therefore, it is essential that QOL tools are developed along robust procedures that include literature searching, consultation with expert groups, testing and psychometric properties analysis. QOL measures chosen in research studies should demonstrate reliability, validity, responsiveness to change over time, precision, appropriateness and acceptability of the instruments (Buck, Jacoby, Brígida Patrício 29
30 Literature review Massey, & Ford, 2000). Thus researchers should choose measures that have been developed this way such as the World Health Organization Quality of Life (WHOQOL) instruments (WHO, 1997). QOL instruments can be considered to be generic or specific depending on their content. In health, generic instruments are designed to compare HRQOL across populations and diseases. They can be used as gold standards for overall QOL assessment so their results can be compared through different groups and individuals (Cummins, 2005; Khanna & Tsevat, 2007; Opara & Jaracz, 2010; L. Williams et al., 1999). They may inform and monitor outcomes, monitor people s health and estimate the burden of different conditions. This allows comparison across pathologies, levels of health and age ranges, however, the results cannot be directly comparable to those given by specific QOL instruments for disabled groups (Cummins, 2005). Otherwise, disease-specific instruments incorporate questions related to symptoms that are usually affected by specific diseases and are used to assess HRQOL in people in that specific condition (Khanna & Tsevat, 2007; Opara & Jaracz, 2010; L. Williams et al., 1999). Therefore, when using the instruments, it is crucial to know if they are adequate for the aim of the study (Opara & Jaracz, 2010). In this study different groups will be compared (general population, PWA and caregivers), so generic QOL instruments such as the WHOQOL are more appropriate. QOL measures can also embrace objective and subjective perspectives in rating (Cummins, 2005; Verdugo et al., 2005; WHO, 1997). Subjective information is typically ascertained through satisfaction or importance judgements made by the individual. Some QOL measures focus entirely on objective information, whilst others such as the WHOQOL instruments include subjective perspectives (WHO, 1997). Additionally, instruments typically measure QOL, HRQOL or well-being independently, but the WHOQOL instruments bridge the gap between them (Hawthorne, Davidson, et al., 2006). A structured review made by Haywood, Garratt, and Fitzpatrick (2005) about generic selfassessed health instruments in older people based on 122 articles related to 15 different instruments revealed that the Short-Form General Health-36 (SF-36) was the most extensively used and that it had a good reliability, validity and responsiveness, followed by the Nottingham Health Profile (NHP) (Hunt, McKenna, McEwen, Williams, & Papp, 1981) and the EuroQol (EQ-5D) (EuroQolGroup, 1990). They also concluded that SF-36 is recommended when a detailed and broad ranging assessment of HRQOL is required, particularly in older people with lower levels of morbidity. The EQ-5D is recommended when a more succinct assessment of health status is required, particularly for patients in whom a substantial change in health is expected (Haywood et al., 2005). Brígida Patrício 30
31 Literature review Much of the psychometrics literature is based on studies of one instrument, however a small body of literature reports on psychometrics of two instruments or more in the same sample, which allows more awareness choices for the researchers. Willige, Wiersma, Nienhuis, and Jenner (2005) studied the suitability of EQ-5D and WHOQOL-Bref for psychiatric patients. According to their results EQ-5D is less sensitive to changes in social and psychological well-being than WHOQOL- Bref. The EQ-5D has been often used as an index in economic evaluations and thus, more suitable for that than to assess these patients QOL (Willige et al., 2005). Unalan, Soyuer, Ozturk, and Mistik (2008) compared the suitability of SF-36 and the WHOQOL-100 for people with stroke (people with communication problems were excluded) and concluded that both instruments are useful in the practical evaluations of patients with stroke (Unalan et al., 2008), but Huang, Wu, and Frangakis (2006) observed that both instruments seem to measure different constructs: the WHOQOL-Bref measures overall QOL, including both health-related and non-health related QOL, whilst the SF-36 assesses aspects of health and activities generally affected by health conditions. Additionally, SF-36 is more focused in the objective QOL perceived states, while the WHOQOL-Bref is more focused in the self-perceived subjective QOL, which means that is focused in the satisfaction with these states (Huang et al., 2006). According to Veenhoven (2000) SF-36 is a measure of individual s internal capability of life and the WHOQOL a measure of inner life satisfaction or subjective enjoyment of life (Veenhoven, 2000). This means that the differences between the results in both instruments may reflect that individuals successfully adapt and cope with health problems, they may overcome the poor functioning or severity disability as measured by SF-36 and live a satisfying life as measured by the WHOQOL-Bref (Huang et al., 2006). Accordingly to these findings, the WHOQOL-Bref seems to be a reliable instrument to capture QOL in clinical populations. As outlined above (Haywood et al., 2005), there are three popular measures of choice. The EQ- 5D is available in many languages including EP, has 6 items that cover mobility, self-care, daily activities, pain/discomfort and anxiety/depression, and is brief to complete resulting in minimum respondent burden (Haywood et al., 2005). However, its brevity is a disadvantage in the context of this study where detailed information is desired on Portuguese population, PWA, and caregivers, and it has no item on SR which is a core concern to both PWA and caregivers. The SF-36 is considered a gold standard, is available in many languages and is more detailed with 36 items and 8 domains, however it has been proven to be difficult for people with aphasia to complete because of heavy linguistic and cognitive demands (Cruice, Hirsch, et al., 2000; Cruice, Worrall, & Hickson, 2010). The NHP is based on a yes or no answer-type which is very restrictive considering the detail required for this study; additionally, according to Oliveira and Orsini (2008) the NHP is more Brígida Patrício 31
32 Literature review a physical and emotional health measure, having some problems with the assessment of QOL, thus also not appropriate for this study. Considering the fact that the use of WHOQOL instruments (WHOQOLGroup, 1993) have been increasing around the world, being also one of the most used instruments to assess QOL (CPRO, 2007; Huang et al., 2006; Khanna & Tsevat, 2007), and the advantages already presented on WHOQOL tools, these instruments will be discussed below World Health Organization quality of life instruments A project was initiated in 1991 by the WHOQOL Group aiming to achieve an internationallyapplicable and cross-culturally comparable instrument that assesses QOL. More than 30 centres were involved worldwide developing new national versions according to a standardised protocol (CPRO, 2007). The principles that guided the development of this instrument address the following criteria: it is a comprehensive instrument (includes all the domains and items considered essential); it is a subjective measure self-administered or interviewer assisted and includes subjective ratings of QOL since individuals perception of QOL varies depending on their expectations (it is influenced by their adjustable internal standards); it is sensitive to the various domains of QOL (capable to show their relative importance); and it has cultural relevance and is cross-culturally comparable (CPRO, 2007). The WHOQOL instruments incorporate the subjective assessment approach alongside an objective tool, by including questions about the satisfaction that the individuals feel with their functioning, and how important it is for them. WHOQOL instruments also include the environment and the interactions between the people and the environment which were not studied when using other QOL assessments (Cruice, Worrall, et al., 2000; WHO, 1997). Two instruments have been created and these are discussed in turn below. The WHOQOL-100 is an instrument representing 24 facets organised into six domains: physical; psychological; level of independence; SR; environment; and spiritual/religion/personal beliefs. It has four questions per facet with a total of 96 questions and four additional questions related to subjective aspects of global QOL and health. The 100 items reflect the questions considered important by specialists and people from general population. All answers are completed using a Likert scale. The WHOQOL-100 is cross-culturally applicable and is based on the individual s perceptions about their QOL in the last two weeks (CPRO, 2007; Khanna & Tsevat, 2007; Moreno et al., 2006). Brígida Patrício 32
33 Literature review The WHOQOL-100 is a comprehensive instrument, but takes a long time to complete. Therefore, a short version with 26 items has been developed, the WHOQOL-Bref (Khanna & Tsevat, 2007; Moreno et al., 2006). The WHOQOL-Bref has a four-domain structure: the physical domain is merged with the level of independence domain; and the psychological domain is merged with the spirituality, religion, and personal beliefs. The WHOQOL-Bref contains one item from each of the 24 facets of WHOQOL-100 and two additional items designed as indicators of overall QOL, which are How would you rate your QOL? and How satisfied are you with your health? (Hawthorne, Herrman, & Murphy, 2006; Khanna & Tsevat, 2007; Moreno et al., 2006). The conceptual and psychometric criteria were taken into account when Bref items were selected from the longer version. The comprehensive nature was preserved, the questions with the strongest item-total correlation were selected (Moreno et al., 2006), and psychometric and focus group procedures were used (CPRO, 2007). The WHOQOL-Bref is an instrument with items that can be adapted, added or withdrawn once demonstrated that it is a need for that population (CPRO, 2007; Hawthorne, Davidson, et al., 2006; Hawthorne, Herrman, et al., 2006). Thus, to ensure cultural sensitivity there are subtle differences between different countries/populations versions (Hawthorne, Herrman, et al., 2006). The Portuguese versions are equivalent to the standard versions (Canavarro et al., 2009; Serra et al., 2006). In the specific case of WHOQOL, the focus groups and expert opinion from culturally and economically different countries represents an underlying common construct. It is therefore an instrument with high ecological validity. This cross-cultural perspective allows comparisons of diverse populations in various cultural settings and countries. In fact, the rigorous standards of instrument development used for the WHOQOL allow comparisons between cultures and also between different services or treatments and longitudinal studies of interventions with less risk of bias (Power, Quinn, Schmidt, & WHOQOLGroup, 2005; WHOQOLGroup, 1993). The WHOQOL instruments are available in more than 40 languages (Huang et al., 2006), for example, the English and the European Portuguese versions of the WHOQOL-100, and the English, European Portuguese, Chinese, Czech, Farsi, Indonesian, Polish, Russian and Taiwan WHOQOL-Bref versions (Canavarro et al., 2009; Li, Young, Xiao, Zhou, & Zhou, 2004; Serra et al., 2006; Skevington et al., 2004; WHO, s.d.). Various studies from different countries have reported good psychometric properties of the WHOQOL-100 and the WHOQOL-Bref, and data is available for the Portuguese WHOQOL instruments (Canavarro et al., 2009; Chen et al., 2009; Fleck, Leal, et al., 1999; Fleck, Louzada, et al., 1999; Fleck et al., 2000; Ginieri-Coccossis et al., 2009; Huang et al., 2006; Kalfoss, Brígida Patrício 33
34 Literature review Low, & Molzahn, 2008; Liang et al., 2009; Noerholm et al., 2004; Serra et al., 2006; Usefy et al., 2010; Wang, Yao, Tsai, Wang, & Hsieh, 2006; Yao & Wu, 2009; Yao, Wu, & Yang, 2008). Skevington et al. (2004) studied, adults from 24 different centres (23 different countries) who completed the WHOQOL-Bref. The results showed no evidence of ceiling and floor effects for any item and the Cronbach s alpha was good for all domains ( ) except for SR which was acceptable (0.68) (the only three items of the SR domain may contribute for these results). For the majority of the countries, discriminant validity was significant for every domain in the total sample; and it was more evident in the physical domain, followed by the psychological, SR and environment. Item-total correlations showed generally good results (Skevington et al., 2004). According to these authors, future research should focus on more comprehensive global data collection, also using structured samples of patients (Skevington et al., 2004) Stroke specific quality of life assessment Some instruments have been widely used to measure the QOL of people with stroke (Jaracz & kozubsky, 2003; Kim, Warren, Madill, & Hadley, 1999; Kranciukaite & Rastenyte, 2006; Malheiro, Nicola, & Pereira, 2009) such as: the Stroke Adapted 30-item version of the Sickness Impact Profile (SA-SIP-30) (Straten, Haan, Limburg, & Bos, 2000); the Stroke version of Quality of Life Index (QLI) (Ferrans & Powers, 1985); the Stroke Impact Scale (SIS) (Duncan et al., 1999); and the Stroke Specific Quality of Life Scale (SS-QOL) (L. Williams et al., 1999). WHOQOL-Bref has also been shown to be suitable for people with stroke (Oliveira & Orsini, 2008). All the disease specific instruments mentioned above accommodate the stroke-specific aspects; the SA-SIP-30 and the SS-QOL include some items of social interaction, but they are focused on dysfunction and difficulties (Malheiro et al., 2009; Straten et al., 2000; L. Williams et al., 1999). This study is focused in importance and satisfaction with functioning, so these are not adequate instruments for this purpose. The stroke version of the QLI focus on importance and satisfaction, but is too long with its 72 items and only a few items are about SR (Kranciukaite & Rastenyte, 2006) which is a key concept for this study People s with aphasia quality of life assessment Although a number of stroke-specific QOL scales have been developed, most exclude PWA and people with cognitive disabilities. In order to overcome this limitation, Hilari, Byng, Lamping, and Smith (2003) adapted the SS-QOL resulting in a specific interviewer-administered self-report scale for PWA: the Stroke Aphasic Quality of Life Scale (SAQOL-53 and SAQOL-39). The longer version Brígida Patrício 34
35 Literature review (SAQOL-53) has all the items of the SS-QOL plus four items related to difficulties with understanding speech, difficulties with making decisions and the impact of language problems on family and social life. These items were introduced to increase the content validity with this population. It has 12 domains based on the SS-QOL: self-care; mobility; upper extremity function; work; vision; language; thinking; personality; mood; energy; family; and social roles. The response format is based on a five-point Likert scale. The sample of this study (Hilari, Byng, et al., 2003), was composed of 74 people with mild to moderate aphasia and nine with severe aphasia, and showed that the shortest version (SAQOL-39) is likely to have better psychometric results. In SAQOL-39 the items are grouped in four domains: physical; psychosocial; communication; and energy (Hilari, Byng, et al., 2003). There are some cultural adaptations of the SAQOL-39: Greek (Kartsona & Hilari, 2007); Brazilian Portuguese (Portero-McLellan, Rocha, Sakzenian, & Panhoca, 2009; Ribeiro, 2008); Spanish (Lata- Caneda, Piñeiro-Temprano, García-Armesto, Barruego-Egido, & Meijide-Failde, 2009); Italian (Posteraro et al., 2004; Posteraro et al., 2006); Dutch (A. Manders, Dammekens, Leemans, & Michiels, 2010); and European Portuguese (Rodrigues & Leal, 2013). The Portuguese version is very recent so it was not available when decisions were made on QOL measures for this study. Furthermore, it is focused in the difficulties people have doing things, so does not align with this study concerns. Several other instruments such as the SF-36, the Dartmouth COOP Charts, the How I Feel About Myself Well-being Scale (Cruice, Worrall, Hickson, & Murison, 2003, 2005), the WHOQOL-Bref, the Psychosocial Well-being Index (PWI) (Ross & Wertz, 2002, 2003) and the Aachen Life Quality Inventory (ALQI) which is a German adaptation of the SIP specifically validated for brain-damaged patients after neurosurgical treatment (Engell, Hütter, Willmes, & Huber, 2003) have also been used to assess the QOL/HRQOL of PWA. According to Ross and Wertz (2003) PWI was less sensitive than the WHOQOL-Bref to differences in the QOL between people with and without aphasia and the SR was one domain that showed it. Some studies (Cruice, Hill, Worrall, & Hickson, 2010; Cruice, Worrall, & Hickson, 2006) used open-ended questioning methods to capture PWA s QOL (asking PWA and/or their proxies) avoiding to limit the responses and, thus, enabling people to think and express every aspect considered important to them (Cruice, Hill, et al., 2010). In this study a robust standardised measure that efficiently captured data through many participants was needed so the interview method was inappropriate for its time and resource intensiveness. There are a few studies that used the proxies of PWA and the SAQOL-39 (Cranfill & Wright, 2010; Hilari, Owen, & Farrely, 2007), the SF-36, the Dartmouth COOP Charts, or the How I Feel Brígida Patrício 35
36 Literature review About Myself Well-being Scale (Cruice et al., 2005). Almost all data showed that proxies and practitioners tend to underestimate patient s QOL (Cranfill & Wright, 2010; Cruice et al., 2005; Hilari et al., 2007), so research has demonstrated that these tools should be completed by PWA themselves, thus others are not reliable as proxies or substitutes (Cranfill & Wright, 2010; Cruice et al., 2005; Hilari et al., 2007). There are several instruments that capture QOL and some can be suitable to, at least, some PWA, but even a comprehensive instrument may neglect some constructs that are important to people s QOL, especially when in specific conditions such as aphasia. According to Ross and Wertz (2003) supplementary standardised items, considered as personally relevant, should be provided as a complement (Ross & Wertz, 2003) and regarding PWA, since SR are insufficiently represented in QOL instruments, instruments need to be adapted (Cruice, Hirsch, et al., 2000). Since no Portuguese QOL and aphasia instruments were available at the time this study began and once we decided to use a population based instrument, the WHOQOL-Bref that has only three items on its SR domain, it was decided to use the longer version of this domain from WHOQOL-100. Further detail on this decision will be given in methods section Quality of life of general population A wide and deep review of the literature within health and outside health was undertaken in this chapter in order to have grounding for the investigation. The following databases were searched: Medline; Pubmed; Cochrane Library; B-on; PsyclNFO; and Web of Science. The references section of the papers were also examined to find more relevant literature. Grey literature was also consulted when considered relevant. The search was undertaken in English and Portuguese and the papers published in peer-reviewed journals were prioritised. This subsection includes a brief introduction, and then the studies are presented. The earliest published paper found considered relevant was included in the literature review and then followed chronological order. Whenever possible, the country, sample size, instruments used, and main results on overall QOL, QOL domains, and its relationships with variables such as age, gender or other relevant variables are presented. Afterwards, a summary of study s findings is presented. There is a vast amount of literature about the QOL of general population (Bowling, 1995; Brajša- Žganec, Merkaš, & Šverko, 2011; Canavarro et al., 2009; Hawthorne, Herrman, et al., 2006; Hsieh, 2008; Saxena, Carlson, Billington, & Orley, 2001; Skevington et al., 2004; Spagnoli, Caetano, & Silva, Brígida Patrício 36
37 Literature review 2012). Several published papers aim to study the psychometric properties of the instruments and/or aim to compare the results of general population QOL with those of other groups, such as unhealthy groups (thus some unhealthy groups data will be generally presented in this section) (Canavarro et al., 2009; Ginieri-Coccossis et al., 2009; Kalfoss et al., 2008; Molzahn, Skevington, Kalfoss, & Makaroff, 2010; Serra et al., 2006; Skevington et al., 2004). Having an integral and multidimensional view of the QOL of the general population will allow identifying and planning the adequate support needs and will be useful for the orientation of the activities carried out by healthcare service providers and to adjust health and community programs and policies. The earliest published study found considered relevant was Farquhar s (1995). This study was carried out in London with 40 participants and aimed to identify individuals view of the quality of their lives. The results showed that older people are willing and able to talk about this subject and that when they use the term QOL they are thinking about good and bad things in their lives. Using in-depth unstructured interviews, when asked to describe the quality of their lives, individuals spontaneously classified it with adjectives such as good or bad and explained why. Some of the oldest people referred that their lives had no quality and tended to describe their QOL with more negative terms than the younger ones. Those living in a semi-rural area were more likely to describe their QOL in a more positive way than those living in the inner city. Results showed that family relationships, social contacts, general health and functional status are valuable components of QOL (Farquhar, 1995). In the study carried out with 2000 adult British individuals, Bowling (1995) concluded that 62% of the sample rated their lives as very good or good. Individuals aged 55 and over were more likely to classify their life as as good as can be. Females aged over 65 were more likely than men of the same age to report this. Single females aged 16 to 25 were more likely to rate their lives as as good as can be or as very good than single males; the inverse was observed for single males and females aged 25 to 45. In response to a generic question about the five most important things in their lives the first thing listed were relationships with family or other relatives, followed by their own health, other person s health and finances/standard of living/housing. Social life and leisure activities was also frequently mentioned (Bowling, 1995). Fleck, Louzada, et al. (1999) used the WHOQOL-100 and concluded, from a study with 50 healthy people and 250 patients with mean age of 44 years, all from Brazil, that QOL in the first group was higher in all domains and that the domains with the highest score for this group were level of independence and spirituality. The lower ones were environment and physical domain (Fleck, Louzada, et al., 1999). Brígida Patrício 37
38 Literature review Another Brazilian study (Fleck et al., 2000) used the WHOQOL-Bref in 50 healthy participants and 250 patients. Results showed that, within the four domains of WHOQOL-Bref, the highest scores in general population were for the physical domain and for the SR in the patients group. The lowest ones were environment for general population and also environment and physical domain for the patients group. All the domains had better results in the general population than in the group of patients. When the content validity of the instrument was analysed, the domain which had weakest correlations with the others was SR. It is also the domain which did not enter in the multiple regression as a predictor of QOL; 44% of QOL was explained by the other three domains (Fleck et al., 2000). Lloyd and Auld (2002) studied the role of leisure in determining QOL, whether it is influenced by placed-centred attributes such as urban parks, sporting and entertainment facilities and services, or by person centred factors such as sense of achievement, social interaction, individual s level of satisfaction with, and attitudes toward their leisure lifestyle. Using a sample composed by people from general population, the authors (Lloyd & Auld, 2002) concluded that leisure satisfaction and participation in leisure activities explained a significant proportion of the variation in QOL, contributing positively to QOL. People who engage in social activities more frequently and who are more satisfied with the psychological aspects of the leisure experience, presented higher levels of perceived QOL. Thus, person-centred leisure attributes have a greater influence in QOL than placedcentred indicators (Lloyd & Auld, 2002). The WHOQOL Group published the results of a study that analysed the psychometric properties of the WHOQOL-Bref (Skevington et al., 2004). The sample consisted of subjects from 24 centres with an age range from 12 to 97 and mean age of 45 years. The findings support that all the domains are scored worst in unhealthy people than in healthy people and that also QOL is worse in the unhealthy group. In addition, the psychological and SR domains showed significant differences indicating that women have better SR but poorer psychological functioning than men. The mean domain ranges decrease with age and the greatest changes are in physical domain (Skevington et al., 2004). Noerholm et al. (2004) published a study with normative data for the Danish general population. The sample was composed of 1101 subjects aged from 20 to 79 years who responded to WHOQOL- Bref. Analysis of the four domains indicated that the ones with widest ranges are the physical domain followed by the environment. SR and psychological domains had an equal range. Analysing the data by gender, the authors (Noerholm et al., 2004) found that genders ranges were equal for Brígida Patrício 38
39 Literature review all but two domains: psychological and SR domains, in which females gave more importance to SR than males. The study of Arnold et al. (2004) examined the contribution of the physical, social and psychological functioning to overall QOL. A large number (1851) of healthy subjects from the Netherlands responded the Medical Outcome Study Short-Form General Health Survey (SF-20). The highest QOL mean was for social functioning, followed by the physical and, at least, the psychological functioning. The results of a regression analysis showed that psychological functioning had the strongest independent relation with overall QOL (Arnold et al., 2004). Wahl et al. (2004) studied the QOL of 1893 Norwegians aged years from general population using the Norwegian version of the Quality of Life Scale. They concluded that women reported higher QOL than men. Furthermore, gender was significantly associated with items such as relationship with parents, having and rearing children, relationship with close friends, helping and encouraging others, participating in public affairs, self-expression, socialising and entertainment. Individuals with higher levels of education reported higher QOL and education correlated significantly to material comforts, health, helping and encouraging others, participating in public affairs, learning, understanding oneself, work, self-expression, active recreation, and independence (women scored higher than men). Although no correlation was found between age and the total score of QOL, age correlated positively and significantly with material comforts, having and rearing children, relationship with spouse, participating in public affairs, and active recreation, and correlated negatively with learning. Marital status also influenced the QOL: married or cohabitant individuals reported higher scores and the separated men reported the lowest scores. The items less affected by marital status were self-expression, socialising, active recreation and independence. Occupational status also influenced QOL scores: unemployed individuals reported lower scores, which affected all items except for self-expression. In addition, respondents with health problems reported lower overall QOL and lower scores in all individual items, except for entertainment, than the healthy ones. Among all items, the highest level of satisfaction for the whole sample was found in material comforts, close relationships with spouse and close relationships with friends (Wahl et al., 2004). L. Leung and Lee (2005) studied the effects of social support, leisure activities, internet activities and media use on 696 Hong-Kong citizens perceived QOL. Social support was significantly correlated to QOL as well as the participation on community or religious activities. People with higher levels of positive social interaction, affection and emotional and informational support showed higher scores in the Satisfaction with Life Scale (L. Leung & Lee, 2005). Brígida Patrício 39
40 Literature review The survey of Hawthorne, Herrman, et al. (2006) was carried out with a random sample of Australian adults and the results showed that the overall scores of WHOQOL-Bref domains were, in a descending order: environment; physical; psychological; and SR. Concerning age and gender, females score decline slightly in the physical domain between years and declined more quickly afterward. Male physical health scores showed a progressive decline between years, then a steeper decline between and years. In the psychological domain, female scores were reasonably stable across all age cohorts, which was also observed for males until the age of 79, and then there was a smoother decline. Female and male SR results were reasonably constant across ages, though, males scored three to five points lower than females. In general, the findings were consistent with other studies relating health and QOL: when health status declines, so does QOL (Hawthorne, Herrman, et al., 2006). The findings of Wang et al. (2006) showed that in Taiwan adults (n=13083) there are only nonsignificant minor gender differences on the four WHOQOL-Bref domains. The older the patients, the less satisfaction they report in the psychological domain. Furthermore, more than 50 years olds reported considerably lower satisfaction in the physical subscale. Minor age difference exists in either the social or environment domains. People with higher education levels gave higher scores across the four subscales (Wang et al., 2006). In Brazil, Moreno et al. (2006) found that, in a zero to 100 scale, the WHOQOL-Bref physical domain had the best scores (mean of 74) followed by the SR and the psychological domain (both with a mean of 70) and that environment had the lowest score (mean of 57). The overall QOL mean score was 70 and the results for the question about satisfaction with general health had a mean of 64 (Moreno et al., 2006). Also in Brazil, Fleck, Chachamovich, and Trentini (2006) applied the WHOQOL-OLD module to 424 old adult (60-80 years), 33% of them unhealthy. The overall mean QOL score was 71 for the healthy group and as 58 for the unhealthy. All the facets scored higher in the healthy than in the unhealthy group. In a descending order, the scores for the healthy group were: sensory abilities (mean=79); past, present and future activities (mean=72); social participation (mean=71); intimacy (mean=70); autonomy (mean=70); death and dying (mean=65). For the unhealthy the results were: sensory abilities (mean=63); death and dying (mean=62); intimacy (mean=59); autonomy (mean=57); past, present and future activities (mean=56); social participation (mean=52). Furthermore, the findings showed statistically significant correlations between QOL and depressive and hopelessness symptoms. Hence, the higher the hopelessness and depressive symptoms, the less the QOL domains scored (Fleck et al., 2006). Brígida Patrício 40
41 Literature review According to the results of a study carried out by Serra et al. (2006) with Portuguese people from general population (N=315) and unhealthy people (N=289), both older than 18 years, healthy people had statistical significant better scores then patients in all domains of the European- Portuguese version of the WHOQOL-Bref. The patients were recruited from psychiatry, gynaecology, rheumatology, orthopaedic/oncology hospital departments and health centres. In a descending order, the results of the domains for general population were: physical; psychological; SR; and environment. For patients it was: SR; psychological; environment; and physical. Social relationships had acceptable results in both groups, although, general population classified it lower than patients in relation to other domains. Within patients this domain had good results when comparing to other domains. Analysis of a multiple linear regression revealed that all the domains were good QOL predictors explaining 58% of total variation. These results support those obtained in a pilot study of WHOQOL-Bref in Portugal and in other centres. This study also revealed that there is a negative correlation between QOL and depressive symptoms (Serra et al., 2006). Based on an extensive and critical review of literature on leisure and QOL from a global international perspective, Iwasaki (2007) concluded that leisure-like activities help to promote people s QOL. Being involved in leisure activities contributes to develop positive emotions, greater self-esteem, social and cultural connections, and well-being (Iwasaki, 2007). Kalfoss et al. (2008) studied the suitability of the WHOQOL-Bref for Canadian and Norwegian older people. One hundred and ninety two (192) Canadian and 469 Norwegian subjects aged 60 to 95 years old (mean=74) were recruited. All the domains scored lower in the Norwegian sample. In a descending order, the mean results for the domains in the Norwegians were: environmental; SR; psychological; and physical domain. The results for the Canadians were quite different: environment; physical; psychological; and SR. The authors also found that the WHOQOL-Bref discriminates between healthy and unhealthy groups (Kalfoss et al., 2008). According to M. Levasseur, Desrosiers, and Tribble (2008), the QLI scores decrease with more activity limitations in older adults, thus, reduced activity level seems to influence negatively the QOL. The level of participation in activities of daily living (ADL) and social roles, as well as the satisfaction with participation scores are also negatively associated to activity limitations. Concerning happiness, the 34 years worth of American data collected by the General Social Survey and analysed by Robinson and Martin (2008), revealed that happy people engaged in significantly more social activities, religious participation, newspaper reading and watching TV. In a study conducted in Portugal, with the same sample as Serra et al. (2006), but using the WHOQOL-100, QOL of general population was also found to be higher than patients QOL Brígida Patrício 41
42 Literature review (Canavarro et al., 2009). Also in this study, SR is well placed in the ranking of domains. In the healthy group it had the second highest score and in the patients group, it was the first. Environment (healthy participants) and physical domain (patients) had the lowest scores (Canavarro et al., 2009). In the study of Molzahn et al. (2010) the relative importance of the facets of the WHOQOL-100 and the WHOQOL-OLD to older adults from 22 different countries, was analysed. The sample was composed of 7401 individuals who responded to the questionnaire in a self-administered or interviewed way. The mean age of the sample was 73 years. Results showed that all the facets were considered important, scoring over three in a five-point scale, except the sex satisfaction facet. The highest importance given by the older adults was attributed to the ability to perform ADL, to be healthy, to have sensory abilities and the ability to move around, to have freedom and independence. The least importance was given to sex life, chance to learn new skills and to the ability to participate in community activities. Comparing genders, women rated the importance of all domains higher than men, except for sex. Using a stepwise multiple regression that controlled the small influence of gender, age, and health status, the most important facets were having energy, being happy, having well-functioning senses, and being free from pain (Molzahn et al., 2010). The study of Gameiro et al. (2010) included the same 315 individuals from Portuguese general population as Canavarro et al. (2009) and Serra et al. (2006), and analysed the influence of gender, marital status, educational level, socioeconomic status, and living place (rural versus city) in QOL domains. The instrument used was the WHOQOL-100. Results showed that men were more satisfied with the psychological domain than women. The opposite was observed for spirituality. Age correlated negatively with all the domains, except for spirituality that correlated positively, and significantly with physical, independence, SR, and spirituality. Regarding marital status, divorced/separated and widower individuals had significantly worse results in SR, environment and spirituality. Educational level seemed to influence QOL domains results, since undergraduate and postgraduate degrees were associated with better QOL domains results. Socioeconomic status was significantly associated to the following QOL domains: physical, independency and environment. No significant statistical differences were observed regarding living place. Predictors were identified for each domain: physical domain was predicted by educational level and marital status (8%); psychological domain was predicted by gender and marital status (4%); independency was predicted by age, socioeconomical status, and marital status (8%); SR were predicted by age, marital status, and educational level (9%); Environment was predicted by socioeconomic status, and marital status (8%); and spirituality was predicted by age, gender, level of education, and Brígida Patrício 42
43 Literature review marital status (7%). Overall, the percentages of total variance explained were very low (Gameiro et al., 2010). The study of Brajša-Žganec et al. (2011) investigated how leisure activities contribute to subjective well-being according to gender and age, in a group of 4000 Croatian citizens aged more than 18 years. The Subjective Well-Being Scale (SWB) instrument and the Leisure Activities Scale were the instruments used. In these instruments, almost all activities involve the use of communication and/or language abilities. The results showed a good level of SWB (6.7 in a 10-point scale) with no differences between males and females, which uniformly declined with age for both genders. Participation in several leisure activities improved SWB of Croatians and diverse leisure activities seem to be associated to age and gender. Family leisure activities such as visiting friends and going to church significantly contributed to the improvement of SWB of men and women of all ages, as well as activities such as going to the theatre, reading books and attending concerts. All women aged from 18 to 60 years and men aged from 31 to 60 years who participated in active socialising and going out had higher levels of SWB. Visiting cultural events significantly contributed to SWB of people with more than 30 years (Brajša-Žganec et al., 2011). Cruz, Polanczyk, Camey, Hoffmann, and Fleck (2011) published normative QOL data for people from Brazilian general population living in Porto Alegre using the WHOQOL-Bref. The sample was composed of 751 participants aged 20 to 64 years, 38% men and 62% women. The results showed that males scored higher than females in all QOL domains, as well as healthy people. People with the lowest number of years of education had worse domain scores than those with the highest education level. Additionally, younger people showed significantly better QOL, and people with lower socioeconomic status had worse QOL. The SR domain was the one with the best scores overall, followed by psychological, environment and physical domain. According to the subgroups studied, SR was the domain with the greatest satisfaction in all of them, and participants were less satisfied with the physical or environmental domains (Cruz et al., 2011). To study the validity of the Subjective Happiness Scale (four-item scale), Spagnoli et al. (2012) used a sample of 1017 adults of Portuguese general population. The gold measure used was the Satisfaction with Life Scale (five-item scale). The results confirmed the validity of the instrument and showed that the whole sample perceived a moderate sense of subjective happiness. In general, the females registered the highest scores, although no significant differences were found among gender. The authors divided the sample in five groups according to age: years; years; years; years; years. They found that the youngest and the oldest group presented Brígida Patrício 43
44 Literature review the highest scores but that there were no significant differences between the age groups (Spagnoli et al., 2012). Analysing all these studies, most of them involving European citizens, we can see that the general population usually classifies their QOL as moderate or good and that variables such as age, gender, health, education, marital status, living place, employment and emotional status influence the QOL of general population (Canavarro et al., 2009; Farquhar, 1995; Fleck et al., 2000; Gameiro et al., 2010; Hawthorne, Herrman, et al., 2006; Serra et al., 2006; Skevington et al., 2004; Wahl et al., 2004; Wang et al., 2006). The relation between the variables may differ from study to study according to the culture, and sample. The areas of life most frequently referred to as important in the reviewed studies were: SR (for both general population and patients); activities and participation; physical; environment; and psychological. In Portugal, when using the WHOQOL-100, the SR were the second most scored domain by healthy people and the first one by patients (Canavarro et al., 2009). Using the WHOQOL- Bref, Portuguese healthy people scored the SR in third place (Serra et al., 2006). In general, the QOL declines when age increases and the physical domain is the one that decreases the most (Gameiro et al., 2010; Hawthorne, Davidson, et al., 2006; Skevington et al., 2004). Females reveal better QOL than males, especially in the social domain but men scored the sex item higher than women (Hawthorne, Davidson, et al., 2006; Molzahn et al., 2010). Regarding education, people with higher levels of education reported higher levels of QOL (Gameiro et al., 2010; Wahl et al., 2004) and people living in rural areas described their QOL more positively than people living in the inner city (Farquhar, 1995). Being married or living with a companion was a status associated to better QOL, as well as being employed (Wahl et al., 2004). Having depressive symptoms was associated to lower levels of QOL (Fleck et al., 2006). Different studies also showed that patients reported different (lower) results of QOL when compared to healthy people (Canavarro et al., 2009; Fleck et al., 2000; Serra et al., 2006; Skevington et al., 2004; Wahl et al., 2004), thus it is important to study the QOL of patients, especially those less studied, in order to understand the areas of life most affected and to develop strategies and treatments to enhance these domains and their overall QOL. This leads us to the purpose of the present study which is to study the QOL of a specific group (PWA). The variables identified in this section (age, gender, health, educational level, marital status, living place, employment and emotional status) are studied in this project. Brígida Patrício 44
45 Literature review 2.4. Quality of life of people with stroke Aphasia results mainly from stroke so QOL stroke studies may have important data to analyse. The search strategy for the stroke QOL studies was the same of the previous section, so databases were searched along with the references list of papers to find more relevant studies. The search was undertaken in English and Portuguese and the papers of peer-reviewed journals were prioritised. The earliest published paper found considered relevant was included in the literature review and then followed chronological order. This subsection includes a brief introduction and then the results of the studies are presented in tables according to sample characteristics, method and main findings. Studies with original data will be presented in tables, whilst systematic reviews will be presented in text format linking its results with those of our literature review. The number of people who survive a stroke and live with its consequences is increasing (ACS, 2009; Man, Yip, Ko, Kwok, & Tsang, 2010; Tengs, Yu, & Luistro, 2001). Therefore, the concerns about QOL of these people have been increasing too, and many studies have been undertaken to investigate their QOL, life satisfaction and subjective well-being (Astrom, Asplund, & Astrom, 1992; Clarke, Marshall, Black, & Colantonio, 2002; Gargano, Reeves, & Investigators, 2007; Haan, Limburg, Van der Meulen, Jacobs, & Aaronson, 1995; Haley, Roth, Kissela, Perkins, & Howard, 2010; Jaracz & kozubsky, 2003; Jonsson, Lindgren, Hallstrom, Norrving, & Lindgren, 2005; Kim et al., 1999; King, 1996; S. Levasseur, Green, & Talman, 2005; Mayo, Wood-Dauphinee, Robert, Durcan, & Carlton, 2002; Niemi, Laaksonen, Kotila, & Waltino, 1988; Patel et al., 2006; L. Williams et al., 1999). The characteristics, aims, and the main findings of the studies with original data examined are reported in the tables 1 and 2. Brígida Patrício 45
46 Literature review Study Niemi et al. (1988) Sample size 46 (6 with aphasia) Table 1: Sample characteristics of stroke QOL studies Stroke sample data Gender Age (years) Time post-stroke Respondents Excluded people 19 Women Mean: 48 3 months and 4 years People with stroke Severe aphasia 27 Men Dementia People that could not complete the questionnaires Astrom et al. (1992) 50 Mean: 71 3 months and 3 People with stroke 17 Women years 33 Men Close relative or friend (if necessary) Severe aphasia Cognitive deficits Haan et al. (1995) 44 King (1996) Women Mean: Women Mean: 73 6 months People with stroke N.a.* 230 Men Proxy (if necessary) 39 Men Range: to 3 years People with stroke Cognitive and language function inadequate to participate Kim et al. (1999) Clarke et al. (2002) Mayo et al. (2002) Jaracz and kozubsky (2003) Jonsson et al. (2005) S. Levasseur et al. (2005) Kong and Yang (2006) Patel et al. (2006) Martins (2006) * Not available Women Mean: to 36 months 29 Men Range: People with stroke People that could not complete the questionnaires Cognitive impairment Receptive and expressive aphasia 282 stroke 52 Women Mean: 76 N.a.* People with stroke Severe cognitive impairment 5056 without stroke 230 Men Aphasia 434 stroke 249 Women Mean: without stroke 187 Men 6 months People with stroke 72 stroke 46 Women Mean: 65 6 months People with stroke Dementia 110 without 26 Men Range: Severe aphasia stroke 304 stroke 123 Women Range: and 16 months People with stroke People that could not complete the questionnaires 234 caregivers 181 Men Women Mean: Men Range: Mean: 7 months People with stroke N.a.* People that could not complete the questionnaires Women Range: months People with stroke Severe stroke 63 Men Significant aphasia 342 N.a.* N.a.* 1 and 3 years People with stroke Cognitive impairments People that could not complete the questionnaires Women Mean= and 2 years People with stroke Severe communication 42 Men Range: informal caregiver (if disability necessary) Brígida Patrício 46
47 Literature review Study Gargano et al. (2007) Sample size Table 1: Sample characteristics of stroke QOL studies (continued) Stroke sample data Gender Age (years) Time post-stroke Respondents Excluded people Women Mean: 64 3 months People with stroke 163 Men caregivers (if necessary) N.a.* Haley et al. (2010) 272 stroke 139 Women Mean: without 133 Men Range: stroke * Not available 9 to 12 months People with stroke Inability to communicate in English The sample sizes of the studies were between 46 and 441 individuals (S. Levasseur et al., 2005; Niemi et al., 1988) with both genders, mainly with more than 6 months post stroke. Some studies used proxies when the included individuals could not complete the questionnaires (Astrom et al., 1992; Gargano et al., 2007; Haan et al., 1995; Martins, 2006), but the majority of the studies excluded people with communication problems such as aphasia (Astrom et al., 1992; Clarke et al., 2002; Haley et al., 2010; Jaracz & kozubsky, 2003; Jonsson et al., 2005; Kim et al., 1999; King, 1996; Kong & Yang, 2006; Martins, 2006; Niemi et al., 1988), so overall the findings do not reflect PWA s living experience. These study s characteristics are in accordance with Kranciukaite and Rastenyte s (2006) stroke and QOL systematic review findings. Table 2: Aims and main findings of the stroke QOL studies Study Aims Methodology Main findings Niemi et al. (1988) Determine the QOL of stroke survivors Longitudinal Assessments at: 3M, and 4Y QOL was not re-established in 83% of the stroke patients Most affected domain: leisure time activities People who did not return to work had worse QOL Oldest patients had worse QOL, especially for leisure time activities Men had slightly worse QOL than women, especially in leisure activities Motor impairment influences QOL No differences between PWA and others People that restored or improved QOL had higher scores for intelligence and memory Stronger predictor of QOL: depression, difficulties in ambulation, independency in daily living activities and memory Stroke impacts on QOL People with stroke need encouragement, psychosocial support and adjustment training after stroke Brígida Patrício 47
48 Literature review Table 2: Aims and main findings of the stroke QOL studies (continued) Study Aims Methodology Main findings Astrom et al. (1992) To describe different aspects of psychosocial function after stroke and the development of changes over time Longitudinal Assessments at: 3M, 1Y, 2Y, and 3Y At 3 months social contacts reduced At 1 year social contacts with friends improved but maintained lower than in general population 3 years after stroke people had more psychiatric symptoms, lower functional ability, and lower life satisfaction To identify mental, functional, and social factors associated with low life satisfaction late after stroke Older people, more depressive symptoms, people that lived alone, that were less independent, that had fewer contacts had worse QOL Life satisfaction lower results were at 3 months, wherein 32% classified as "good"; at 1 year it increased for 52% People that reported poor life satisfaction at 1 year maintained it for the 3 years Haan et al. (1995) To analyse the impact of stroke types and lesion locations on QOL Cross-sectional High levels of dysfunction in body self-care, communication, eating household, management and ambulation were reported Less severe dysfunctions: sleep, emotional behavior and social interaction Physical and psychosocial functioning were worse than in general population Relationship between QOL and comorbidity, stroke severity and supratentorial stroke type Left hemisphere lesions had better results in all domains except for communication Oldest had worse results in physical and psychosocial domains No relationship between QOL and gender King (1996) To examine overall and domain-specific QOL in stroke survivors To identify variables that predict QOL after stroke Cross-sectional QOL similar to general population QOL predictors: depression, perceived social support and functional status Ability to communicate has great importance for life Kim et al. (1999) To describe the overall QOL of stroke survivors To examine the relationships between sociodemographic variables, neurological variables, functional status, social support, perceived health status, depression, and overall QOL Cross-sectional Health and functioning had the lowest results Important items 3 years after stroke: ability to get around, ability to do things, not having a job, usefulness to others and stress - all with lower levels of satisfaction Lower level of satisfaction with leisure time activities Depression is negatively associated to QOL Being married, perceived adequate social support from a close personal relationship is positively correlated with overall QOL Age, gender, education, living arrangements, stroke type and lesion location did not correlate significantly with QOL To determine the best predictors of QOL Clarke et al. (2002) To investigate patterns of well-being in community-dwelling stroke survivors To identify factors that restrict and enhance well-being Cross-sectional People with stroke had lower levels of well-being, particularly in their sense of mastery and control over their lives, and their ability to engage in positive relationships People with stroke are more likely to experience restrictions on their ADL Cognitive impairment limits sense of purpose and meaning Depression limits sense of mastery and acceptance Mental health, physical and cognitive impairment associated to reduced sense of well-being in people with stroke Higher levels of education and/or adequate social support can moderate stroke impact Brígida Patrício 48
49 Literature review Table 2: Aims and main findings of the stroke QOL studies (continued) Study Aims Methodology Main findings Mayo et al. (2002) To estimate the extent of activity and participation of individuals 6 months post stroke and their influence on HRQOL and overall QOL Cross-sectional Participation in ADL is associated to better QOL Stroke people report lack of meaningful activities Jaracz and Kozubski (2003) To describe global and domain-specific after stroke QOL To identify the factors that are important for post-stroke QOL Cross-sectional QOL relatively good for stroke survivors People with stroke had lower overall QOL and lower results in all domains Health and functioning had the lowest results Speaking and moving are perceived as the most important Family was the most scored dimension Emotional support, depressive symptoms and functional disability predicted QOL (explained 38%) Jonsson et al. (2005) To examine longitudinal changes of QOL covering physical and mental factors in a group of stroke patients and their informal caregivers Longitudinal Assessments at 4 and 16 months Caregiver had better QOL than patients except for emotional and mental domains Social, emotional and mental domains improved in patients Physical functioning decreased in patients There were no changes in caregivers QOL QOL determinants in patients at 16 months: depressive symptoms, functional status, age and gender Levasseur et al. (2005) To examine the applicability and construct validity of the SEIQoL-Direct Weight for measuring QOL in stroke survivors Cross-sectional Relationships with family and friends is the most important domain Social and leisure activities and health follow social relationships Perceived health status is associated to depressive symptoms Kong and Yang (2006) To assess HRQOL among chronic stroke survivors and factors associated with it Cross-sectional Age, gender, post-stroke duration, side of hemiplegia and Barthel Index (BI) results were not associated to HRQOL Depression was associated to HRQOL Patel et al. (2006) To estimate levels of disability, handicap and HRQOL up to 3 years after stroke To examine the relationships between domains Longitudinal QOL comparable to general population except for physical functioning Positive correlation between HRQOL and disability and handicap Disability is strongly correlated to HRQOL in physical functioning and moderate for social functioning Up to 3 years patients perceptions of physical health is low but mental health is satisfactory Martins (2006) To assess the QOL of people with stroke Longitudinal Low results in all QOL domains Ability to use the affected member, ability to participate in social and spiritual activities, ability to work and to participate in ADL were the lowest scored domains No significant differences in QOL perceptions between males and females Communication significantly decreased from 1 to 2 years post-stroke Communication correlated with memory and participation in ADL Age is negatively and significantly correlated with QOL at 1 and 2 years post-stroke Emotional status is not correlated with QOL Dependent individuals had worse QOL Individuals with more neurological deficits had worse QOL Stroke type had no correlation with QOL Marital status had no correlation with QOL Brígida Patrício 49
50 Literature review Table 2: Aims and main findings of the stroke QOL studies (continued) Study Aims Methodology Main findings Gargano et al. (2007) To examine sex differences in stroke survivors QOL Cross-sectional Females had lower mood score than males Women feel less satisfied with their level of memory and concentration Women had lower functional recovery Women had lower levels of QOL Age, stroke type or comorbidities do not explain the findings Haley et al. (2010) To measure the impact of stroke on QOL Longitudinal Stroke had negative effects on QOL, depression, mental health and physical health To analyze whether race, gender, age, or living alone moderated changes in QOL Living alone/social isolation is a risk factor for worse QOL, and for developing depressive symptoms No race and gender differences in QOL results In the studies reported above we can observe that stroke survivors have worse QOL after stroke (Astrom et al., 1992; Clarke et al., 2002; Haley et al., 2010; Jaracz & kozubsky, 2003; Kim et al., 1999; Martins, 2006; Niemi et al., 1988). The same was found by Oliveira and Orsini (2008), Mota and Nicolato (2008), and Kranciukaite and Rastenyte (2006) in their systematic reviews. Stroke limits the participation in ADL, the engagement in SR, the functional status and the emotional and mental health (Clarke et al., 2002; Haley et al., 2010; Jaracz & kozubsky, 2003; Kranciukaite & Rastenyte, 2006; S. Levasseur et al., 2005; Martins, 2006; Mayo et al., 2002; Niemi et al., 1988; Oliveira & Orsini, 2008; Patel et al., 2006). As shown, depressive symptoms, disability, participation in ADL correlate significantly with QOL (Haan et al., 1995; Jaracz & kozubsky, 2003; Jonsson et al., 2005; Kim et al., 1999; King, 1996; Kong & Yang, 2006; Patel et al., 2006) and the maintenance or re-establishment of social ties seems to be an important determinant of QOL in long term survivors of stroke (Kranciukaite & Rastenyte, 2006); the importance that people gave to the SR support these findings (Jaracz & kozubsky, 2003; S. Levasseur et al., 2005). Likewise in Mota and Nicolato s (1995) review, some studies identified age and gender as determinant aspects for people with stroke s QOL (Gargano et al., 2007; Jonsson et al., 2005), but Haley et al. (2010), for instance, found no differences between gender. Haan et al. (1995) also found an association with stroke severity. Additionally, Kranciukaite and Rastenyte (2006) verified that the severity of motor impairment, incapacity to return to work, impaired cognition and the presence of comorbid health problems contribute to the reduction of QOL in stroke individuals. Some of the studies of this literature review also observed these results (Jaracz & kozubsky, 2003; Niemi et al., 1988; Patel et al., 2006). Through a systematic review method, Tengs et al. (2001) concluded that there is a large variation in the instruments used to assess QOL for the same health condition and a considerable variation in the rigor of methods used to estimate QOL, which may hinder reliable comparisons. Brígida Patrício 50
51 Literature review Although not reported in the tables above, the mentioned studies used different instruments to assess QOL and correlated variables, e.g. SF-36, QLI, and SS-QOL (Gargano et al., 2007; Jonsson et al., 2005; King, 1996; Kong & Yang, 2006). The use of core instruments is desirable, so the QOL studies may contribute with reliable data about the impact of stroke in patients QOL and might strongly influence the investment in stroke prevention and treatment relative to other conditions (Oliveira & Orsini, 2008; Tengs et al., 2001) Quality of life of people with aphasia The search strategy for this section was the same of the previous two, so databases were searched along with the references list of the papers to find more relevant studies. The search was undertaken in English and Portuguese and the papers of peer-reviewed journals were prioritised but grey literature was also considered when reporting Portuguese or Brazilian data. The earliest paper found considered relevant was included in the literature review and then followed chronological order. Therapy studies were not included. As in the previous section, it includes an introduction and results from all studies are presented in tables according to sample characteristics, method and main findings. Aphasia is an acquired communication disorder caused by neurological damage characterised by a multimodal language impairment which may include speaking, understanding, reading and writing. It cannot be explained by motor or sensory deficit as well as intellectual deficit or psychiatric disorder (Goodglass, 1993; Hallowell & Chapey, 2008). There are many aphasia classifications. The most widely used is based on lesion location and language impairment including speech fluency, naming, auditory comprehension and repetition, which classifies aphasia as (Goodglass & Kaplan, 1972): Broca s aphasia; Wernicke s aphasia; conduction aphasia; anomic aphasia; global aphasia; transcortical sensory aphasia; transcortical motor aphasia and transcortical mixed aphasia(goodglass & Kaplan, 1972). This is the classification used in this Thesis. As a chronic acquired communication disorder, most people who suffer from aphasia see their lives changed forever. Changes occur at a linguistic and communicative level but also at different levels of daily living and QOL (Cruice et al., 2006; LaPointe, 2005; A. Manders et al., 2010; Pound, Parr, Lindsay, & Woolf, 2000). Aphasia affects the biopsychosocial integrity of the individuals compromising the participation in ADL, in social activities, the ability to work, and their Brígida Patrício 51
52 Literature review emotional status (LaPointe, 2005; Michallet, Tétreault, & Dorze, 2003; Pound et al., 2000; Zemva, 1999). The changes may involve the loss of communicative partners, participation in less activities, role changes, social isolation, dependency, and the development of depressive symptoms (Ardila, 2006; Berthier, 2005; Grawburg et al., 2013a; Jordan & Kaiser, 1996; Patrício, 2007; Währborg, 1991). To face all the changes, the psychosocial adjustment of the PWA and their families is very important (Cruice et al., 2006; Peña-Casanova, Manero, & Bertran-Serra, 1995). The communicative condition of PWA is a methodological challenge in the area of QOL studies because they may have difficulties completing self-reported instruments. In fact, self-reported instruments are generally less suitable for people with moderate to severe cognitive disorders and speech and language disorders. In many studies of QOL of people with stroke, PWA were excluded (see section 2.4.), in some it is not clear whether they were included or not and in studies that did include PWA, those with moderate to severe aphasia were excluded or resulted in missed assessments. Some studies have therefore resorted to proxy respondents (Sarno, 1997), however QOL is quite a subjective concept, so the use of proxies is questionable. Statistical significant differences among PWA s responses and those given by the proxies have been reported, with PWA perceiving their QOL better than proxies (Cranfill & Wright, 2010; Cruice et al., 2005; Hilari et al., 2007), so the method of capturing QOL thorough proxies seems to be restrictive and unreliable. Thus eliciting information from PWA directly is preferable, as previously mentioned. To assess people with severe aphasia QOL, it is required, at least, some modification of the testing materials and special skills on behalf of the interviewer. Improving the QOL of PWA is the ultimate goal of the clinicians who work with PWA (Worrall & Holland, 2003). Usually clinicians believe that when language and communication improve, QOL also increases. Nevertheless, it is necessary to determine the extent of the impact of aphasia in people s lives as well as the benefits of rehabilitation on their QOL (Cruice et al., 2003; Worrall & Holland, 2003). Enquiring the person about this is essential for a good practitioner care and to inform management (Cruice et al., 2006). Despite the available research on language impairment and communication disabilities, only a few studies have looked at tested proven relationships among language impairment, communication ability and QOL outcomes in PWA (Cruice et al., 2003; Hilari, Needle, & Harrison, 2012; Ross & Wertz, 2002). A review of QOL literature (Cruice, Worrall, et al., 2000) suggested that communication had not been investigated as predictor or factor that may influence QOL most probably because of its implicitness. Consequently, there is a very limited research on statistical significance of how communication disability significantly influences people s Brígida Patrício 52
53 Literature review QOL (Cruice et al., 2003; Hilari et al., 2012). The studies found in our literature review are presented in tables 3 and 4. Table 3: Sample characteristics of PWA QOL studies PWA sample characteristics Study Sample size Gender Age (Years) Time post-stroke Included people Respondents Hinckley PWA (1998) 31 PWA 12 Women Mean: 50 Mean: 46 months Fluent and non-fluent Mild, moderate and severe 19 Men Range: months Zemva (1999) Ross and Wertz (2002) Engell et al. (2003) 20 PWA 5 Women Mean: 68 Range: 1-48 months 20 Broca PWA 20 Relatives 15 Men Range: PWA 5 Women Mean: 61 Mean: 43 months 5 Anomic PWA 18 Non-brain 13 Men Range: months 4 Conduction Interviewer injured 3 Broca assistance if necessary 2 Wernicke 4 Residual 26 PWA 9 Women Mean: 54 Mean: 12 months 8 Global PWA 24 Partners 17 Men Range: Range: 1-63 months 6 Broca 1 Wernicke 1 Transcortical sensory 1 Amnesic 2 Residual 4 Fluent non-classifiable Cruice et al. (2003) Ross and Wertz (2003) Hilari et al. (2003) *Not available 3 Non-fluent non-classifiable 30 PWA 16 Women Mean: 71 Mean: 41 months Mild to moderate PWA 14 Men Range: Range: months 15 Anomic 8 Conduction 3 Broca 3 Wernicke 1 Transcortical sensory 18 PWA 5 Women Mean: 61 Mean: 43 months 5 Anomic PWA 18 Non-brain 13 Men Range: months 4 Conduction Interviewer injured 3 Broca assistance if necessary 2 Wernicke 4 Residual 83 PWA 31 Women Mean: 62 1 year N.a.* PWA 52 Men Range: Table 3: Sample characteristics of PWA QOL studies (continued) Brígida Patrício 53
54 Literature review Study Cruice et al. (2006) Ribeiro (2008)** Bose et al. (2009) Lata-Caneda et al. (2009) Manders et al. (2010) Sample size PWA sample characteristics Gender Age (Years) Time post-stroke Included people Respondents 4 PWA 4 Women Mean: 59 Range: 1-4 years N.a.* PWA 4 Significant others Range: PWA 16 Women N.a.* 6 months 4 Anomic PWA 30 General population 14 Men 14 Broca 6 Conduction 6 Mixed 19 PWA 5 Women Mean: 65 Mean: 42 months 5 Anomic PWA 19 Controls 14 Men Range: Range: months 7 Broca 2 Global 2 Wernicke 3 Mixed aphasia 23 PWA 7 Women Mean: 57 Mean: 44 months 9 Broca PWA 16 Men Range: months 1 Wernicke 5 Transcortical motor 3 Transcortical sensory 1 Anomic 4 Global 43 PWA 18 Women Mean: 62 Mean: 4 months Good to moderate 43 Brain injured 25 Men Range: comprehension PWA Cruice, Hill et al. (2010) Cruice, Worrall et al. (2010) Rodrigues and Leal (2013) *Not available **Grey literature 43 Healthy Women Mean: 71 Mean: 41 months 15 Anomic PWA 14 Men Range: Range: months 8 Conduction 30 PWA 16 Women months 14 Men 75 Without aphasia 3 Broca 3 Wernicke 1 Transcortical sensory Moderate comprehension 33 PWA 16 Women Mean: 67.5 Mean: 32 months 5 Global PWA 17 Men Range: Broca Range: months 10 Anomic 2 Wernicke 5 Conduction 1 Transcortical motor 1 Transcortical sensory PWA The sample sizes of the studies reviewed were between 4 and 83 PWA (Cruice et al., 2006; Hilari, Wiggins, Roy, Byng, & Smith, 2003) of both genders, but the majority of the studies had a sample size between 20 and 30 participants (Bose, McHugh, Schollenberger, & Buchanan, 2009; Cruice, Hill, et al., 2010; Cruice, Worrall, et al., 2010; Cruice et al., 2003; Engell et al., 2003; Lata- Brígida Patrício 54
55 Literature review Caneda et al., 2009; Ribeiro, 2008; Ross & Wertz, 2002, 2003; Zemva, 1999). The great majority had more than 6 months post stroke and the age range was of 21 to 88 years (Bose et al., 2009; Cruice, Hill, et al., 2010; Cruice et al., 2006; Cruice, Worrall, et al., 2010; Cruice et al., 2003; Hilari, Wiggins, et al., 2003; Hinckley, 1998; Lata-Caneda et al., 2009; Ribeiro, 2008; Rodrigues & Leal, 2013; Ross & Wertz, 2002, 2003). Interviewer assistance was given if necessary in some studies (Ross & Wertz, 2002, 2003). Table 4: Aims, methodology and main findings of PWA QOL studies Study Aims QOL instrument Methodology Main findings Zemva (1999) To establish handicaps most commonly occurring in the life of aphasic patients and their relatives Interview Cross-sectional PWA were more troubled by their communication disability than their relatives PWA reported changes in family and social life and at emotional level Hinckley (1998) To investigate the predictors of lifestyle satisfaction among younger adults with chronic aphasia Ross & Wertz (2002) Engell et al. (2003) Cruice et al. (2003) To examine relationships between language and/or communication deficits and QOL To determine whether the strengths of these relationships differ between groups To construct and validate a procedure that would allow for selfrating of aphasic patients To investigate how measures of impairment, activity and participation, and measures of QOL related to each other for PWA Questionnaire designed for the study Cross-sectional Turning to wishes, PWA prioritised communication, to be able to speak, complete recovery 45% rated life satisfaction as positive 54% were dissatisfied or discourage with their lifestyle Only time post-onset was a significant predictor of lifestyle satisfaction As time post-onset increases the satisfaction decreases WHOQOL-Bref Cross-sectional PWA scored significantly lower on all measures PWI No significant association between severity of language disability and QOL of PWA No significant relationships were verified between communication activity limitation and QOL Aachen Life Quality Inventory Cross-sectional No significant relationship between QOL and gender No significant relationship between QOL and educational level No significant relationship between QOL and time post stroke SF-36 Dartmouth COOP Charts Well-Being Scale Cross-sectional Language impairment was correlated to QOL Non-fluent individuals complaint more than fluent Strong positive correlation between communication and: social HRQOL; and psychological well-being Emotional and functional limitation correlate with lower QOL Table 4: Aims, methodology and main findings of PWA QOL studies (continued) Brígida Patrício 55
56 Literature review Study Aims QOL instrument Methodology Main findings Ross and Wertz (2003) To determine which WHOQOL-Bref facets differentiate QOL between aphasic and non-aphasic people WHOQOL-Bref Cross-sectional PWA had lower QOL PWI The domains which discriminate most powerfully the QOL of aphasic and non-aphasic people are the level of independence, SR and environment Hilari et al. (2003) To assess the predictors of HRQOL in PWA SAQOL-39 Cross-sectional Within SR domain, respondents' satisfaction with support received from friends and with their sex lives best distinguish QOL between groups Results suggest that aphasic people may benefit from language therapy to enhance communication for specific situations and to reinforce the participation in society Age was significantly and negatively correlated to QOL Time post-stroke and type of stroke were not correlated to QOL Comorbidity was correlated to QOL; more comorbid conditions resulted in poorer QOL High emotional distress was significantly and positively correlated with QOL Lower level of activities was significantly and positively correlated with QOL High communication disability was significantly and positively correlated with QOL Low cognitive level was significantly and positively correlated with QOL Cruice et al. (2006) To explore how older PWA consider the quality of their current lives Interview Cross-sectional Social support was positively but not significantly correlated with QOL Multiple regression analyses of these variables and QOL revealed that only emotional distress, activity level, communication disability and comorbidity were significant predictors of QOL, accounting for 52% of the variance of the SAQOL-39 results Contributors for successful living: having positive experiences in sharing one s life with others; visiting family; socialising, playing with grandchildren; sharing tasks Other important aspects for satisfaction with life: be oneself; having support; having independence (being able to: live alone; travel independently; do things they want to do; to manage one's responsibilities) Ribeiro (2008)** To translate and adapt the SAQOL- 39 SAQOL-39 Cross-sectional To verify its suitability for PWA Better sense of QOL was noticed comparing to a time immediately post-stroke Gender, educational level, and time post stroke had no correlation with QOL Age had a positive correlation with QOL **Grey literature The participants with aphasia revealed lower results in all SAQOL-39 domains comparing to the control group Table 4: Aims, methodology and main findings of PWA QOL studies (continued) Brígida Patrício 56
57 Literature review Study Aims QOL instrument Methodology Main findings Bose et al. (2009) To document the domains of QOL that were most affected for participants with aphasia compared to control participants SAQOL-39 Cross-sectional PWA had significantly lower QOL scores 17-item Quality While controls showed similar values in all subdomains of of SAQOL and QCL, the PWA had different performances Communication across the domains, with communication and Life Scale (QCL) socialization/activities being the most affected domain Aphasia severity strongly correlated with communication and psychosocial subdomains of SAQOL as well as with socialization/activities subdomain of QCL Naming performance correlated strongly with psychosocial domain and socialization/activities and to aphasia severity Lata-Caneda et al. (2009) To translate the SAQOL-39 to Spanish and evaluate its acceptability and reliability SAQOL-39 Cross-sectional Age, level of education and time post stroke did not correlate with any studied variable Mean score for QOL was 3.75 (range: 2.06 to 4.94) Lowest mean score was for the communication domain 3.29 (1.57-5), followed by the psychosocial domain 3.67 (1.63-5), the energy domain 3.98 (1-5) and the physical domain 4.05 (2.40-5) Manders et al. (2010) To examine the QOL of PWA SAQOL-39 Cross-sectional Significant differences between PWA and the healthy control sample for overall QOL and for all domains To study the influence of age, time post onset and social support on the QOL of PWA (not validated version) A comparison between both groups with brain injury showed no differences on the physical and energy domains, but revealed significant differences for communication and psychosocial domains and for the total SAQOL-score PWA had the lowest results in overall QOL and in all QOL domains of SAQOL, except the physical one People who had aphasia for a longer time tended to have better QOL Females with aphasia tend to evaluate their QOL more negatively than males revealing significant differences for the physical and psychosocial domain as well as for the total SAQOL-score Aphasic people who have not finished high school scored significantly lower in physical domain and in overall QOL No significant differences were found regarding to marital status Cruice, Hill et al. (2010) To explore how older people with chronic aphasia who are living in the community describe their QOL in terms of what contributes to and detracts from the quality in their current and future lives PWA who were older than 65 years scored significantly lower than the younger group. Interview Cross-sectional Factors that influence QOL: Activities (previous occupation, personal interests, entertainment, social activities) Verbal communication (speaking to others, going to discussion groups, lack of ability to talk or speak) People (having partners, family and other people in their lives) Body functioning (current physical difficulties, cognitive and sensory functioning) Table 4: Aims, methodology and main findings of PWA QOL studies (continued) Brígida Patrício 57
58 Literature review Study Aims QOL instrument Methodology Main findings Cruice, Worrall et al. (2010) To verify the suitability of the SF-36 for aphasia To report on the impact of poststroke aphasia in HRQOL SF-36 Cross-sectional PWA had significantly lower emotional and mental health PWA with depressive symptoms had lower HRQOL than PWA without those symptoms Rodrigues & Leal (2013) To translate and analyze the psychometric properties of the Portuguese version of the SAQOL-39 SAQOL-39 Cross-sectional SF-36 is not advisable for adult PWA Communication domain had the lowest scores Communication domain was not associated to time post-stroke Age, gender, educational level did not correlate with QOL Time post-stroke is associated to QOL, especially with the physical domain The results of various studies revealed that PWA have lower scores of QOL than people without aphasia (A. Manders et al., 2010; Ribeiro, 2008; Ross & Wertz, 2002, 2003). Emotional status and age seems to be the strongest predictors of PWA s QOL (Bose et al., 2009; Cruice, Worrall, et al., 2010; Cruice et al., 2003; Hilari, Wiggins, et al., 2003; A. Manders et al., 2010; Ribeiro, 2008), but Rodrigues and Leal (2013) did not find the age association in a Portuguese sample. Communication and psychosocial QOL domains were those that better discriminated people with and without aphasia (Bose et al., 2009; Hilari, Wiggins, et al., 2003; A. Manders et al., 2010; Ross & Wertz, 2003). There is also a strong correlation between communication and social HRQOL, psychological wellbeing and QOL (Cruice et al., 2003; Hilari, Wiggins, et al., 2003). Greater importance was given by PWA to communication ability, socialising and participating in activities, as contributors for their life satisfaction (Cruice, Hill, et al., 2010; Cruice et al., 2006; Hilari, Wiggins, et al., 2003). Language impairment was identified as a predictor of QOL by Engell et al. (2003), Bose et al. (2009) found correlations with communication, socialisation, activities and psychosocial well-being, and Rodrigues and Leal (2013) with time post-stroke. Overall, these data reveal an important need for coordinated efforts to help individuals with aphasia in their communication skills, as well as a need to address the many psychosocial issues which impact negatively on people s with aphasia QOL (Sarno, 1997). These studies also showed the variation of the instruments used to assess QOL of PWA, though SAQOL-39 is the most consistently used. Only Ross and Wertz (2002, 2003) used a general population-based instrument (WHOQOL-Bref), nevertheless the sample was small. Using a general population-based instrument with PWA is desirable because it allows comparisons to other long term conditions or even with general population, but bigger samples of PWA are needed. Additionally, it can be verified that the Brígida Patrício 58
59 Literature review data on Portuguese PWA is scarce; the only study available was focused on validating the SAQOL- 39 and not extensive studying the influence of aphasia in PWA s QOL (Rodrigues & Leal, 2013) Quality of life of the caregivers of people with stroke and poststroke aphasia The literature search strategy of this chapter was different from the previous chapters. In this chapter the opportunity was used to search with systematic review method. The search was conducted to identify studies that report data related to the QOL of the caregivers of PWA, and their QOL predictors. The following databases were searched: Medline; Pubmed; Cochrane Library; PsyclNFO; and Web of Science. Studies were considered for review if: published in peer-reviewed journals; published in English or Portuguese; reported original data; participants included adult caregivers of PWA; reported data on factors associated or predictive of PWA s caregivers QOL. No restrictions were imposed regarding study design. No other exclusion criteria were applied. Searches were conducted using the following keywords: Aphasia AND caregiver OR relative OR family (OR families ) AND quality of life OR well-being OR life satisfaction OR burden OR consequences OR needs. A total of 1745 potential citations were identified in the initial search on the 27 th of March From those, 1719 were excluded because: were duplicated citations, were not peer-reviewed, were not written in English or Portuguese, did not address QOL or related subjects on PWA s caregivers, did not include adult caregivers of PWA, and did not report original data. Additionally, five (5) more studies were excluded because although they include PWA s caregivers, did not report data specifically on them. Twenty one (21) studies were included in the final analysis. Two authors independently reviewed the titles, abstracts and keywords of every study. If the information given in the title, abstract and keywords suggested that the study might fit the inclusion criteria, the full article was retrieved for further assessment. From the full articles, the decision to exclude a study was based on agreement by both authors. Papers meeting the inclusion criteria were coded for sample data (caregivers and PWA), aims, methodology, and main findings. Two reviewers conducted the coding independently, each using a complete copy of the retrieved paper and summarised the extracted data in a data table. Agreements between the reviewers occurred for 95% of the occasions and the disagreements were solved through discussion. The data of the 21 studies included is reported in tables. This section includes an introduction based on a broader literature review that included studies of caregivers with stroke and post-stroke aphasia and the Brígida Patrício 59
60 Literature review systematic reviews papers found; afterwards the data of the 21 studies of the systematic review are reported in the Tables 5 and 6. The efforts to reduce the length of institutionalisation and to promote community care rely on informal caregivers (Donelan et al., 2002). Many stroke survivors return to the community with limitations and in need for support (C. Anderson, Linto, & Stewart-Wyne, 1995). In this situation, a chronically disabled person often destabilise the family life and disrupt the established balance within the family, whose members play a major role in supporting their impaired relative (Glozman, 2004; Kitzmuller et al., 2012; Kulkarni, Chamberlain, & Porrit, 1992; Rombough, Howse, Bagg, & Bartfay, 2007). Families face great challenges adjusting to the consequences of stroke and to their additional role as caregivers of a person with stroke. The pressure on caregivers can be overwhelming, occurring changes at a physical, mental, psychological and social level, in their participation, activities, and QOL (Bugge, Alexander, & Hagen, 1999; Clarke, Black, Badley, Lawrence, & Williams, 1999; Exel, Koopmanschap, & van den Berg, 2005; Rombough et al., 2007). Therefore, there is an urgent need of early recognition of caregivers difficulties that may help to prevent or to relieve their burden as well as to develop appropriate interventions and support programs (Donelan et al., 2002; Heuvel et al., 2002). The life functioning study of people when faced with a health condition of their significant others can be named as the third party disability (Threats, 2010). The studies with stroke caregivers have some inconsistences reporting the demographic variables and have lack of information on the severity of the stroke, (Exel et al., 2005; Kalra et al., 2004; Rombough et al., 2007), so comparing results is difficult. Nevertheless, some conclusions can be drawn: caregivers QOL is worse than normative values (Bugge et al., 1999); age of the caregiver, and the patient functional status are important determinants of caregivers QOL (Bethoux, Calmels, Gautheron, & Minaire, 1996; Jonsson et al., 2005); strain and burden are negatively associated to caregivers QOL (Blake & Lincoln, 2000; Morimoto, Schreiner, & Asano, 2003; Scholte op Reimer, de Haan, Rijnders, Limburg, & van den Bos, 1998) and health status (Bugge et al., 1999; Exel et al., 2005; Tang & Chen, 2002); is positively associated with stroke severity (Bugge et al., 1999) and amount of required hours of care (Bugge et al., 1999; Jeng-Ru, Hills, Kaplan, & Johnson, 1998), but is not associated to caregivers gender (Blake & Lincoln, 2000). Caregivers frequently report lower levels of self-esteem, depression, changes in social activities, in marital satisfaction and financial problems (C. Anderson et al., 1995; Bethoux et al., 1996; Blake & Lincoln, 2000; Blonder, Langer, Pettigrew, & Garrity, 2007; Rombough, Howse, & Bartfay, 2006). Depression and diminished social Brígida Patrício 60
61 Literature review support is associated to lower levels of life satisfaction (Grant, Elliot, Giger, & Bartolucci, 2001). Increasing responsibilities and less time to socialise and to be engaged in leisure activities diminished their QOL as well (White, Lauzon, Yaffe, & Wood-Dauphinee, 2004). The caregiving situation seems to be negatively associated to caregivers QOL (Bugge et al., 1999; White et al., 2004), but the literature reviewed above does not include PWA in the stroke samples, and thus it is now reviewed below. The loss or impairment of the ability to communicate is typically devastating and frustrating to both the stroke survivor with aphasia and his or her primary caregiver and can result in fear, feeling of hopeless and depression (Hickey, 2001). As well as stroke s caregivers, family members of PWA may have a dual role in the rehabilitation process: as a partner and resource to the rehabilitation team in providing support to the PWA, and as a potential recipient of care, with their own needs and requirements for services (Michallet, Le Dorze, & Tétreault, 2001). Typically, the rehabilitation efforts rely directly on the PWA and do not address caregivers needs, so caregivers are essentially approached as a provider of care but not as a potential recipient of care support (Threats, 2010; Worrall et al., 2010). Since the PWA may depend on the caregiver for many activities, including to communicate and to maintain and develop skills learned in therapy, understanding and supporting caregivers of PWA may help not only the caregiver, but the PWA as well (Threats, 2010). A comprehensive aphasia treatment goes beyond PWA s impairments, including interventions centred in activities and participation (Brundage et al., 2012) and ideally includes PWA and their families, caregivers, and friends, enabling people to live successfully with aphasia (K. Brown, Worrall, Davidson, & Howe, 2012; Holland, 2006). The need to support caregivers of PWA has been recognised (Grawburg, Howe, Worrall, & Scarinci, 2012; McGurk, Kneebone, & Pit ten Cate, 2011). However, little research has focused on caregivers of stroke survivors with aphasia comparing to those without aphasia (McGurk et al., 2011). For example, in the systematic review of Rombough et al. (2006), regarding strain and burden, studies with PWA s caregivers were not found (Rombough et al., 2006). Additionally, according to McGurk et al. (2011) little information has been given in which to base recommendations (McGurk et al., 2011). Grawburg et al. (2013b) systematic review summarised the current knowledge of third party disability in aphasia and showed that there is a negative impact of aphasia in functions, activities and participation of the caregivers, although the authors mentioned that the findings are not conclusive (Grawburg et al., 2013b). Actually, many studies studied caregivers of people with stroke, including caregivers of PWA, but did not report the caregivers of PWA data separately (Blonder et al., 2007; Bluvol & Ford-Gilboe, 2004; Choi-Kwon, Brígida Patrício 61
62 Literature review Kim, Kwon, & Kim, 2005; Lawrence, Kerr, Watson, Paton, & Ellis, 2010; White, Mayo, Hanley, & Wood-Dauphinee, 2003), so it is impossible to differentiate the impact that may be due to aphasia. Despite this, some data is available about the consequences of being close to a PWA, but almost no information is available about the impact of those consequences in caregivers QOL. The data found in the 21 studies of our systematic review is reported in the following Tables (Tables 5 and 6) Brígida Patrício 62
63 Literature review Table 5: Sample characteristics of PWA s caregivers QOL studies Caregiver data PWA data Study Sample size Relationship with PWA Gender Age (years) Gender Age (years) Time post stroke Aphasia severity Type of aphasia Physical disability Christensen & Anderson (1989) 11 Spouses 10 Women Mean: 63 1 Women N.a.* 6 months N.a.* N.a*. Hemiparesis 1 Men 10 Men Williams (1993) 40 Spouses 33 Women N.a.* N.a.* N.a.* 3 months Mild, moderate and 7 Men severe LeDorze & Brassard (1996) N.a.* N.a.* 9 4 Spouses 6 Women Mean: 52 N.a.* Mean: 54 2 years mild to moderate 3 Anomic N.a.* 1 Daughter 3 Men Mean: 7 years 3 Broca 1 Mother 2 Wernicke 1 Niece 1 Conduction 1 Cousin Hemsley & Code (1996) 1 Friend 5 4 Spouses 4 Women N.a.* 2 Women Mean: 67 3 and 9 months N.a.* 2 Anomic 2 Hemiparesis 1 Daughter-in-law 1 Men 3 Men Range: Wernicke 1 Broca 1 Conduction Denman (1998) 9 Spouses 6 Women N.a.* N.a.* N.a.* 12 months N.a.* N.a.* N.a.* 3 Men Santos et al. (1999) 55 Spouses 30 Women Mean: Women N.a.* Range: 1-11 years 50% moderate 9 Broca/Transcortical motor N.a.* 25 Men 30 Men 5 Wernicke/Transcortical sensorial 13 Global/Transcortical mixed 15 Anomic/Conduction 13 Aphasia sequelae *Not available Brígida Patrício 63
64 Literature review Table 5: Sample characteristics of PWA s caregivers QOL studies (continued) Caregiver data PWA data Study Sample size Relationship with PWA Gender Age (years) Gender Age (years) Time post stroke Aphasia severity Type of aphasia Physical disability Pound et al. (2001) 4 Spouses 4 Women Mean: 61 4 Men N.a.* Range: months 1 Moderate N.a.* 2 Hemiplegia Range: Mean: 16 months 2 Severe 1 Hemiparesis 1 Very severe Michallet et al. (2001) 6 Spouses 5 Women Mean: 66 N.a.* Mean: 69 N.a.* Severe N.a.* N.a.* 1 Men Range: Range: Michallet, Tétreault & Le Dorze (2003) 5 Spouses 4 Women Mean: 66 N.a.* Mean: 69 N.a.* Severe 3 Global N.a.* 1 Man Range: Range: Mixed Avent et al. (2005) Spouses 15 Women N.a.* N.a.* N.a.* Range: 1-13 years N.a.* N.a.* N.a.* 2 Adult children 1 Man Mean: 5.5 years 1 Parent Bakas et al. (2006) Spouses 42 Women Mean: Women Mean: 64 N.a.* N.a.* N.a.* N.a.* 19 Adult Children 4 Men Range: Men Range: Other Franzén-Dahlin et al. (2008) Le Dorze et al. (2009) 77 Significant others N.a.* N.a.* 32 Women Mean: 74 6 months 1 to 4 (ANELT) N.a.* N.a.* 45 Men 1 Daughter Women N.a.* 1 Man 60 N.a.* Severe Mixed aphasia Hemiparesis Natterlund (2010) 14 7 Spouses 7 Women N.a.* 5 Women Mean: 56 N.a.* N.a.* Expressive N.a.* 4 Parents 7 Men 9 Men Range: Sibling 1 Child 1 Close friend *Not available Brígida Patrício 64
65 Literature review Table 5: Sample characteristics of PWA s caregivers QOL studies (continued) Caregiver data PWA data Study Sample size Relationship with PWA Gender Age (years) Gender Age (years) Time post stroke Aphasia severity Type of aphasia Physical disability Le Dorze & Signori (2010) 11 Spouses 9 Women Mean: 61 N.a*. Mean: 64 3 years Mild to severe N.a.* 2 Men Range: Range: Mean: 7 years Residual to moderate Nystrom (2011) Spouses 11 Women Range: Women Range: N.a.* N.a.* N.a.* N.a.* 6 Adult children 6 Men 11 Men McGurk et al. (2011) 1 Parent Spouses 121 Women 47 Women N.a.* N.a.* N.a.* N.a.* N.a.* 16 Adult children 29 Men 103 Men Manders et al. (2011) Spouses N.a.* Partners' mean: 60 N.a.* N.a.* 30% 6 months N.a.* N.a.* N.a.* 23 Adult children Children's mean: 41 41% > 6 & 2 years 29% > 2 years Brown et al. (2011) Spouses 15 Women Mean: Women Mean: 63 2 years 17 Mild N.a.* N.a.* 3 Parents 9 Men Range: Men Range: Moderate to 1 Brother severe 1 Adult children Kitzmuller et al. (2012) 11 Spouses N.a.* N.a.* N.a.* N.a.* 3 years N.a.* N.a.* N.a.* Adult children Howe et al. (2012) Spouses 36 Women Mean: Women Mean: 64 N.a.* N.a.* N.a.* N.a.* 5 Siblings 12 Men Range: Men Range: Adult children 2 Parents 6 Other relatives *Not available Brígida Patrício 65
66 Literature review In these studies, the sample size was between one and 150 caregivers, the great majority with less than 50 individuals. They were mainly spouses and women, and had an overall minimum age of 21 years and a maximum of 87 years. Regarding PWA, a large amount of data is unavailable but we can still conclude that the majority were men and that, generally, the minimum age was 25 years and the maximum 88 years. The majority of the studies did not refer to severity or type of aphasia and to the physical disability of the PWA. Many studies did not refer any data on time post onset, but on those available, the minimum time was less than six months (E. Manders, Marien, & Janssen, 2011) and the maximum 13 years (Avent et al., 2005). Almost all the studies used qualitative methodology (see Table 6). Based on the aims and findings of the studies, it can be concluded that the studies mainly describe the experience, identify the consequences and needs of those closely related or caring for PWA. One study approached caregivers life situation predictors (Franzén-Dahlin et al., 2008) and three aphasia characteristics as predictors of caregivers experience (Hemsley & Code, 1996; McGurk et al., 2011; S. Williams, 1993). According to Brown s et al. (2012) study, being a caregiver of a PWA impacts significantly the life situation (K. Brown et al., 2012), but no study reported on caregivers QOL or its predictors (see Table 6). Brígida Patrício 66
67 Literature review Table 6: Studies aims, methodology and main findings Study Aims Methodology Main findings Examine the impact of aphasia Quantitative on spouse role change, emotional problems, social adjustment, and partner's perceived communication abilities Christensen & Anderson (1989) Williams (1993) LeDorze & Brassard (1996) Hemsley & Code (1996) Examine changes in marital satisfaction Describe the experience of aphasia on the basis of personal accounts Identify associations between clinical and functional aphasia and perceptions of emotional and psychosocial adjustment Determine subjective well-being and optimism of significant others of PWA Quantitative Qualitative Quantitative 77% Spouses of PWA experienced role changes. Spouses of PWA have significant more role changes than spouses of people with stroke non-aphasic Spouses of PWA had more social problems than spouses of people with stroke non-aphasic 36% Spouses of PWA report emotional and/or health problems Spouses of PWA tend to talk more with others about their partner's problems Significant differences between spouses pre stroke and post stroke marital satisfaction Areas most referred as affected: lifestyle, finances, sex, interpersonal communications Marital satisfaction is not associated to severity of aphasia, time post stroke, or length of marriage Marital satisfaction is associated to the knowledge about aphasia: the more the knowledge, the less the negative impact on marital satisfaction Interpersonal relationships: role changes; change in intimate relationships; changes in household habits; loss of friends Changes is communicative situations, perception of loss of interest in communication on the part of the PWA Irritation, stress, annoyance, discouragement, effort, fatigue, more responsibilities, more concernments, health problems Feelings of stigmatization when others address the relative or friend instead of PWA Restricted activities: dropping a course; giving up; abandoning plans for vacation; disinvestment in one's career Coping behaviours used by relatives or friends: making new friends amongst people who are also familiar with aphasia; distancing oneself from the PWA; joining association Poor emotional or psychosocial adjustment; Social dysfunction and anxiety were areas of poor adjustment Social dysfunction may be a product of the presence of aphasia regardless of its type or severity Denman (1998) Identify the needs Qualitative Needs: support, information, role change, training and day/respite care Santos, et al. Quantitative (1999) Analyse the opinions of spouses of PWA about problems affecting their QOL Important modifications in their own lives (life changed, had consequent problems and their mood altered). No significant differences found between husbands and wives of PWA. Pound et al. (2001) Examine the impact of aphasia on the spouses' lives Qualitative Changes: gave up job; no freedom; living on nerves; strain; anxiety about further strokes; less social activities; less contact with children, family and friends; burden; frustration with communication Need for respite Michallet et al. (2001) Identify and describe the needs perceived by spouses of PWA Qualitative Needs: information; enhance communication with the PWA; have better interpersonal relations with family and social network; be considered as a partner in the caring process; emotional and practical support; respite Sense of isolation and exclusion Michallet, Tétreault & Le Dorze (2003) Franzén-Dahlin et al. (2008) Identify the consequences of severe aphasia as experienced by spouses of PWA Examine predictors of life situation of the significant other of aphasic stroke patients Qualitative Quantitative Changes in lifestyle habits: interpersonal relationships, responsibilities, leisure activities, and finances Spouses experienced: fatigue, anxiety, discouragement, loss of privacy, social isolation and burden Coping strategies based on the problems or on the control of the significance of them Living with a PWA affected significantly the life situation of significant others Need for assistance is a life situation predictor: the higher the need, more affected is the life situation Perceived personality change is a life situation significant predictor: the more the change perceived in the PWA, the more affected the life situation Brígida Patrício 67
68 Literature review Table 6: Studies aims, methodology and main findings (continued) Study Aims Methodology Main findings Bakas et al. Quantitative (2006) Avent et al. (2005) Le Dorze et al. (2009) Natterlund (2010) Le Dorze & Signori (2010) Nystrom (2011) Compares selected outcomes among caregivers of aphasic and non-aphasic stroke survivors Identify information needed for family members at the onset of, initial rehabilitation, and chronic phases of aphasia Describe the experience of a daughter s adaptation process to her father s stroke and aphasia during the first year post-stroke Describe the influence of aphasia on caregivers' life situation Identify needs, barriers and facilitators Identify the consequences of being closely related to a PWA Qualitative Qualitative Qualitative Qualitative Qualitative Caregivers of PWA experienced more difficulty with tasks than caregivers of non-aphasic Most difficult tasks for caregivers of PWA: communicating with PWA; managing sadness, depression; dealing with finances; and talking with health professionals. Caregivers of PWA reported lack of time for social activities with family and friends Negative changes for caregivers of PWA in level of energy, financial wellbeing, emotional well-being and roles in life Information needed in all phases: about aphasia; psychosocial support and hopefulness At the onset: significant need for generic information about aphasia and its causes; realistic and positive prognostic information; co-existing behaviour and medical changes resulting from stroke; resources to help family cope with aphasia During treatment: information about the process of aphasia treatment; instructions about how to maximize communicative effectiveness during interactions; about co-existing behaviours and medical conditions (e.g. depression); and about resources (someone to talk to with experience of aphasia) Chronic phase: need for community based information such as volunteer opportunities Sources of stress change over time: negative consequences diminished and more positive indicators emerged Changes: relationship; communication; concernments (relative's survival, health and communication); reduction of leisure and social activities Needs: social and family support and to remain hopeful Conversational strategies provided by speech and language therapists attenuated changes in relationships; accessing information was important to help the PWA, to keep hopeful and contributed to the sense of doing something useful Great changes in life Loss of friends Communication problems in the beginning Sense of emotional loneliness Sense of being the one who does the majority of the practical chores Need for support Practical and emotional support needs Concern about PWA's health, communication, independence and well-being More responsibilities and sense of obligation Facilitators: availability of close others to provide help Barriers: organizational Life is characterized by: loss of freedom; staying; new form of relationship; growing strong together with others Being a bridge between the PWA and the surrounding world Brígida Patrício 68
69 Literature review Table 6: Studies aims, methodology and main findings (continued) Study Aims Methodology Main findings McGurk et al. To assess coping strategies used Quantitative 46% of the participants revealed high levels of depressive symptoms (DS) (2011) by informal caregivers of PWA to More severe communication impairment of the PWA was associated with manage with communication greater DS of the caregiver problems. Manders et al. (2011) Brown et al. (2011) Kitzmuller et al. (2012) Howe et al. (2012) To study the association between depressive symptoms and coping strategies Investigate how important significant others find it to be informed, supported and trained by SLP Investigate to what extent they perceive their expectations and needs to these aspects to be fulfilled Explore family members of PWA's perspective on the meaning of living successfully with aphasia Illuminate the long-term experience of family life after stroke Identify rehabilitation goals family members of PWA have for themselves Qualitative Qualitative Qualitative Qualitative PWA's communication impairment does not predict caregivers DS after controlling the effect of coping Participants satisfied with informal and emotional support reported less DS Satisfaction with practical support was not associated to DS No significant associations were found between DS and: age; gender; PWA's dependency level; or time post stroke Anticipated social support is significantly related to caregivers DS Coping strategies most used: acceptance; active coping; planning; positive reframing; self-distraction; attentiveness to stroke survivors; and proactive facilitating communication Coping strategies least used were avoidant-type (e.g. denial, substance use) Active coping and positive reframing were associated to lower levels of DS Self-distraction, denial, substance use, behavioural disengagement, avoidance and self-blame were associated with higher levels of DS. Problem-focused approach strategies (e.g. active coping, planning) and emotion-focused approach strategies (e.g. positive reframing, acceptance) were most often used to cope with communication problems. 98% stressed the importance of practical training in learning how to communicate with PWA 90% stressed the importance of full participation in rehabilitation process Need for information (oral and written), and training Aphasia affects the whole family and changes caregivers' activities and participation Getting involved with life, support for the PWA, family members' own needs, putting life into perspective, focusing on and celebrating strengths and improvements, sense of hope and positivity, and the experiences with services are important to live successfully with aphasia Closely related with the experience of satisfying relationships and interactions. Needs: information; support; have time for themselves; respite; put their priorities first; balance expectations Gap between children and their disabled parent More misunderstandings and conflicts within the couple Less social activities and social network; loss of friends; loneliness Emotional problems Role changes More responsibilities, burden Living with a person with aphasia impacts on their emotional, mental and physical well-being Goals/needs: inclusion in rehabilitation; provision of hope and positivity; ability to communicate and maintain their relationship with the PWA; supply support and information; opportunity to look after their own well-being (e.g. have time for themselves; respite); ability to cope with new responsibilities From all these studies, it can be observed that caregivers reported mainly emotional and social changes. Thirteen (13) of these studies reported greater emotional changes on PWA s caregivers Brígida Patrício 69
70 Literature review (Bakas, Kroenke, Plue, Perkins, & Williams, 2006; Christensen & Anderson, 1989; Hemsley & Code, 1996; Kitzmuller et al., 2012; Le Dorze, Brassard, Larfeuil, & Allaire, 1996; Le Dorze & Signori, 2010; Le Dorze, Tremblay, & Croteau, 2009; E. Manders et al., 2011; McGurk et al., 2011; Michallet et al., 2001; Nätterlund, 2010; Pound, Parr, & Duchan, 2001; Santos, Farrajota, Caldas, & Sousa, 1999). Emotional problems were mentioned (Bakas et al., 2006; Christensen & Anderson, 1989; Hemsley & Code, 1996; Kitzmuller et al., 2012; Santos et al., 1999) as well as depression (Bakas et al., 2006; A. Manders et al., 2010; McGurk et al., 2011) and concerns about PWA s health and communication (Le Dorze et al., 1996; Le Dorze & Signori, 2010; Le Dorze et al., 2009; Pound et al., 2001). Depression seems to be associated with communication impairment, with satisfaction with informal and emotional support, with anticipated social support, and with active coping and positive reframing (McGurk et al., 2011) of the caregivers. The concerns are especially about the PWA and his/her health. PWA s caregivers were more concerned about their relative s everyday well-being than their own needs and life (Le Dorze et al., 1996; Le Dorze & Signori, 2010; Le Dorze et al., 2009; Pound et al., 2001). Other feelings such as anxiety, irritation, strain, stress (Hemsley & Code, 1996; Le Dorze et al., 1996; Michallet et al., 2001; Pound et al., 2001), annoyance, sadness (Bakas et al., 2006; Le Dorze et al., 1996), sense of emotional loneliness (Nätterlund, 2010), and discouragement (Le Dorze et al., 1996; Michallet et al., 2003), were also reported. Great changes occurred in the social level of PWA caregivers lives as well (Bakas et al., 2006; K. Brown et al., 2011; Christensen & Anderson, 1989; Hemsley & Code, 1996; Kitzmuller et al., 2012; Le Dorze et al., 1996; Le Dorze et al., 2009; Michallet et al., 2001; Michallet et al., 2003; Nätterlund, 2010; Nystrom, 2011; Pound et al., 2001; S. Williams, 1993). Nine (9) studies reported changes in relationships, which were manifested in their marital relations, their relationships with family, with friends and with others from their social circle. For some caregivers, the loss of friends was described as the hardest part (Christensen & Anderson, 1989; Hemsley & Code, 1996; Kitzmuller et al., 2012; Le Dorze et al., 1996; Le Dorze et al., 2009; Michallet et al., 2003; Nätterlund, 2010; Nystrom, 2011; Pound et al., 2001). Seven studies reported communication problems (Bakas et al., 2006; Kitzmuller et al., 2012; Le Dorze et al., 1996; Le Dorze et al., 2009; Nätterlund, 2010; Pound et al., 2001; S. Williams, 1993) that were perceived as devastating, as a source of stress, and leading to loneliness (Nätterlund, 2010). Six studies reported activities changes (Bakas et al., 2006; K. Brown et al., 2011; Kitzmuller et al., 2012; Le Dorze et al., 1996; Le Dorze et al., 2009; Michallet et al., 2003; Pound et al., 2001), and two participation changes (K. Brown et al., 2011; Le Dorze et al., 1996). Loss of freedom and loss of privacy were also felt by caregivers, especially those who live with the PWA (they had to take part Brígida Patrício 70
71 Literature review as informal caregivers whether they agreed or not) (Michallet et al., 2003; Nystrom, 2011; Pound et al., 2001). Loneliness, social isolation (Kitzmuller et al., 2012; Michallet et al., 2001; Michallet et al., 2003), exclusion (Le Dorze et al., 1996; Michallet et al., 2001) and stigmatisation (Le Dorze et al., 1996) were also reported. Social isolation was reported not only as a natural consequence (others stay apart), but also, in a certain degree, as voluntary by the PWA and their caregivers due to the communication difficulties (Michallet et al., 2003; Nätterlund, 2010; Nystrom, 2011). Regarding other changes, responsibilities were the most referred to in the studies (Howe et al., 2012; Kitzmuller et al., 2012; Le Dorze et al., 1996; Le Dorze & Signori, 2010; Michallet et al., 2003; Natterlund, 2010), followed by burden (Kitzmuller et al., 2012; Le Dorze et al., 1996; Le Dorze & Signori, 2010; Michallet et al., 2003; Pound et al., 2001) and role changes (Bakas et al., 2006; Christensen & Anderson, 1989; Kitzmuller et al., 2012; Le Dorze et al., 1996). Caregivers perceived that all responsibilities lay on them, which could be a source of pressure, stress, irritation, fatigue, exhaustion and burden (Michallet et al., 2003; Nätterlund, 2010; Nystrom, 2011). Role changes happened, wherein the caregivers took over roles that the PWA no longer assumed, and this can also be a source of stress (Denman, 1998; Michallet et al., 2003; Nätterlund, 2010). Financial changes (Bakas et al., 2006; Michallet et al., 2003; S. Williams, 1993), health problems (Christensen & Anderson, 1989; Le Dorze et al., 1996) and relinquishing plans (Le Dorze et al., 1996; Pound et al., 2001) were also mentioned. Financial problems were, as well, a source of stress (Michallet et al., 2003) and due to the lack of time to take over all the responsibilities, some carers had to take an early retirement to care for their spouses (Michallet et al., 2003; Nystrom, 2011). Concerning needs, the most frequently reported needs in the studies analysed were support (e.g. support in taking care of a PWA; emotional support for dealing with the consequences of aphasia and day to-day tasks; support for redefining their roles and their life projects) (K. Brown et al., 2011; Denman, 1998; Franzén-Dahlin et al., 2008; Howe et al., 2012; Le Dorze & Signori, 2010; Le Dorze et al., 2009; Michallet et al., 2001; Nätterlund, 2010), information (Avent et al., 2005; K. Brown et al., 2011; Denman, 1998; Howe et al., 2012; E. Manders et al., 2011; Michallet et al., 2001; Nätterlund, 2010), training (e.g. communication training) (Denman, 1998; Howe et al., 2012; Le Dorze et al., 2009; E. Manders et al., 2011; Michallet et al., 2001) and respite (K. Brown et al., 2011; Denman, 1998; Howe et al., 2012; Michallet et al., 2001; Pound et al., 2001). Some other studies mentioned the need to enhance communication with PWA (Howe et al., 2012; E. Manders et al., 2011; Michallet et al., 2001), to have time for themselves (Bakas et al., 2006; K. Brown et al., 2011; Howe et al., 2012) and to be provided with hope and positivity (Howe et al., 2012; Le Dorze et al., 2009). Positive reframing, support and attentiveness to the PWA, and availability of others to Brígida Patrício 71
72 Literature review provide help are coping strategies important for caregivers (K. Brown et al., 2011; Hemsley & Code, 1996; Le Dorze & Signori, 2010; McGurk et al., 2011; Michallet et al., 2003). Marital satisfaction is affected by the presence of aphasia (S. Williams, 1993). Spouses reported decreased sexual desire and some considered divorce, although in many cases it did not happen. A new form of relationship and coping was developed (Nätterlund, 2010; Nystrom, 2011). Time post stroke and severity of aphasia are not associated to marital satisfaction, but the knowledge about aphasia is (S. Williams, 1993). A systematic review of studies reporting the consequences of chronic diseases (other than stroke) on caregivers lives identified some variables or predictors of caregivers QOL, namely: severity of the impairment; functional disability; cognitive and behavioural disorders; and impaired social interactions of the disabled person; age; gender; educational level and socioeconomic status of both; coping strategies; social support; perception of support availability; and type of relationship of the caregiver (Glozman, 2004). The great majority of the analysed studies that included PWA s caregivers did not report these data in detail or did not mention it at all, and this is outlined below. Functional disability of the PWA, cognitive and behavioural disorders of the PWA and socioeconomic level of PWA and caregiver are not reported in the 21 studies analysed. Educational level was reported in two studies, but only for the caregivers (Bakas et al., 2006; McGurk et al., 2011). Impairment severity, physical disability, gender, and age of the PWA and/or of the caregiver are reported in some of them (Avent et al., 2005; Bakas et al., 2006; K. Brown et al., 2011; Christensen & Anderson, 1989; Denman, 1998; Franzén-Dahlin et al., 2008; Hemsley & Code, 1996; Howe et al., 2012; Le Dorze et al., 1996; Le Dorze & Signori, 2010; Le Dorze et al., 2009; McGurk et al., 2011; Michallet et al., 2001; Michallet et al., 2003; Nätterlund, 2010; Nystrom, 2011; Pound et al., 2001; Santos et al., 1999; S. Williams, 1993). The type of relationship of the caregiver with the PWA is reported in all studies. However, except for Santos et al. (1999) study s that presented no differences according to gender in the modifications occurred in caregivers lives (Santos et al., 1999), all these variables were only mentioned to characterise the samples, to check correlations with depressive symptoms or marital satisfaction, and not to determine whether these variables may influence caregivers QOL or not (Avent et al., 2005; Bakas et al., 2006; K. Brown et al., 2011; Christensen & Anderson, 1989; Denman, 1998; Franzén-Dahlin et al., 2008; Hemsley & Code, 1996; Howe et al., 2012; Kitzmuller et al., 2012; Le Dorze et al., 1996; Le Dorze & Signori, 2010; Le Dorze et al., 2009; E. Manders et al., 2011; McGurk et al., 2011; Michallet et al., 2001; Michallet et al., 2003; Nätterlund, 2010; Nystrom, 2011; Pound et al., 2001; S. Williams, 1993). Therefore, Brígida Patrício 72
73 Literature review comparisons cannot be made between these studies, and even between them and studies with a more general chronic sample. It will be essential in future research with caregivers of PWA to systematically collect and report these data when publishing in order to provide better comparisons among studies, relate variables, and provide a better understanding of disability impact on caregivers. Some consequences of living and caring for a PWA were identified, although their QOL has not been explored. According to Exel et al. (2005), patients and caregivers QOL is a strong indicator in identifying caregivers at risk. Studying these outcomes could help to relieve their burden and prevent from further institutionalization of the person with stroke or of the caregiver (Exel et al., 2005). In fact, it appears that aphasia has the potential to reduce QOL, but we don t know if all these changes significantly impact in their QOL or even if some variables are stronger predictors of caregivers QOL than others. The reviewed studies highlighted important issues resulting from communication impairment in caregivers, but there might be several issues to consider additionally, and further research is needed. From all the consequences of stroke, aphasia is a very specific one, thus it might be studied in order to better understand the needs and priorities of PWA and their caregivers. As a result, healthcare could be better focused on PWA s caregivers needs and provide appropriate, relevant and cost-effective interventions and referrals for them. As caregivers are an important source of support and a driving force for PWA s participation in society, caregiverfocused programs may reduce the burden of the impairment even for society. According to White et al. (2004), maintaining caregivers QOL is a very significant factor in the ability and willingness to provide the care required to keep a family member with stroke in the community (White et al., 2004). This suggests an important role for professionals in providing support to caregivers so that they can continue in this role if they wish (Wilkinson et al., 1997). Identifying caregiver QOL is then crucial. It is also important in speech and language therapy, to understand the impact of aphasia on the caregivers QOL and on their needs, and use it to determine the aims of the intervention. Caregivers views of living with aphasia and QOL may contribute with valuable insights into important processes that may influence clinical interventions and community-based services for PWA and their caregivers (K. Brown et al., 2011), and caregivers described their interest and need to be involved in rehabilitation (Howe et al., 2012). As speech and language therapists are knowledgeable about communication and aphasia, they are essential health professionals in planning and implementing services that will promote social participation and QOL of all those affected by aphasia (Le Dorze & Signori, 2010). Brígida Patrício 73
74 Aims and method CHAPTER 3: Aims and Method As shown in the literature review, the data about Portuguese general population QOL is scarce and even scarcer is the data about the QOL of Portuguese PWA and their caregivers. Since the QOL of Portuguese general population was not extensively documented, this study includes the study of a sample of Portuguese general population. Until now, the Portuguese studies have been more focused in translating and adapting instruments, so little attention has been given to the study of variables influence in QOL for general population and PWA, and no published data was found on caregivers of PWA QOL. This study intended to fill this gap studying the influence of a huge range of variables, such as sociodemographic, language and communication, and speech and language therapy (SLT) related, in QOL using a population-based instrument to make it possible to compare with various groups. As SR is a key aspect for the PWA and their caregivers, the influence of the mentioned variables in SR are also studied Aims of the study This project aims to study the influence of communication disability in PWA s and their caregivers QOL and SR. We divided this project in three studies: (1) the study of the QOL and SR of Portuguese general population; (2) the study of the QOL and SR of PWA; (3) the study of the QOL and SR of PWA s caregivers. The aims of the overall study are: - To characterise the QOL and the SR of Portuguese general population, PWA and caregivers; - To determine the influence of sociodemographic variables in the QOL and SR of Portuguese general population; - To determine the influence of sociodemographic variables and variables related to aphasia in the QOL and SR of PWA and caregivers; - To compare the QOL of Portuguese general population, PWA and caregivers; - To compare SR satisfaction of Portuguese general population, PWA and caregivers - To evaluate PWA s experience of completing the WHOQOL-Bref from speech and language therapists perspectives of ease of understanding and responding, assistance required, and length of administration. Brígida Patrício 74
75 Aims and method 3.2. Method Study 1 (Portuguese general population sample) Study design and sample characteristics This is a cross-sectional correlational study. The sample was composed of 255 individuals recruited by a snowball sampling technique that met the following inclusion criteria: to be Portuguese; to live in Portugal; to have 25 years of age or more. More sample procedures details will be given in section The sample sizes influence statistical tests results, so the power of a given test should be analysed to define the minimal sample size required to detect significant differences when differences really exists. Similarly, the minimum effect size that is likely to be detected can be calculated using a given sample (Field, 2009). The sample sizes required for high power values of the tests used in this study (correlation, qui-square and regression) and for minimal effect sizes were calculated with the G*Power tool (see Table 7). Table 7: Sample size for minimum effect sizes and high test power Test Power Alpha Effect size Sample Correlation Qui-square Regression Calculation was also undertaken for the same standard of power, but using the sample size collected (N=255). The effect sizes detected with this sample are small for correlation and regression, and medium for Chi-square (see Table 4). Although a larger sample is required for minimum effect sizes (see Table 7), 255 participants is still adequate (see Table 8). Table 8: Effect size for a sample of 255 and high test power Test Sample Power Alpha Effect size Correlation Chi-square Regression There is no data available in Portugal to determine the representativeness of a sample with the sociodemographic characteristics of this study sample, however it is a close match to Portuguese general population regarding gender (47.78% males and 52.22% females) and mean age (mean age Brígida Patrício 75
76 Aims and method is 41.8 years), according to the National Institute of Statistics (INE, 2012). The percentage of the participants from the Portuguese islands is over-represented in the sample when compared to Portuguese general population proportions (INE, 2012): 95.13% of Portuguese population live in mainland and 4.87% in the islands (INE, 2012) Measures All 255 participants completed the European Portuguese version of the World Health Organization Quality of Life short-form instrument (WHOQOL-Bref) (Serra et al., 2006), the SR domain of the WHOQOL-100 (Canavarro et al., 2009), the European Portuguese version of the Center for Epidemiological Studies Depression Scale (CES-D), (Gonçalves & Fagulha, 2004) and a demographic data sheet The World Health Organization Quality of Life Scale Bref, Portuguese version The WHOQOL-Bref has good to excellent psychometric properties (Chen et al., 2009; Fleck et al., 2000; Huang et al., 2006; Kalfoss et al., 2008; Liang et al., 2009; Noerholm et al., 2004; Serra et al., 2006; Skevington et al., 2004; Usefy et al., 2010; Wang et al., 2006; Yao & Wu, 2009; Yao et al., 2008). It is a self-administered instrument, although interviewer-assisted administration is allowed when necessary (WHO, 1997). It is available in more than 40 languages is cross-culturally comparable (Skevington et al., 2004) enabling comparisons of diverse populations in various cultural settings and countries, and thus has cultural relevance, is comprehensive, is sensitive to the various domains of QOL, and uses a subjective assessment approach (CPRO, 2007; WHO, 1997). The guidelines used in the development of the WHOQOL instruments allow comparisons between cultures and also between different services or treatments and longitudinal studies of interventions with less risk of bias (Power et al., 2005; WHOQOLGroup, 1993). Moreover, the WHOQOL-Bref includes the environment and the interactions between the people and the environment, features which have not been specifically emphasised in the development of many other QOL assessments (Cruice, Hirsch, et al., 2000; WHO, 1997). This instrument (see Appendix A) has 24 facets (areas) and is composed of 26 items distributed in a four-factor structure: physical domain (seven items); psychological domain (six items); SR (three Brígida Patrício 76
77 Aims and method items); and environment (eight items). The WHOQOL-Bref contains one item from each of the 24 facets of WHOQOL-100 (the instrument that led to WHOQO-Bref) and two additional items intended as indicators of overall QOL (Canavarro et al., 2009; Serra et al., 2006; WHO, 1997). The facets of the SR domain are: personal relationships; practical social support; and sexual activity. Likewise other versions, all the domains of the Portuguese instrument have good internal consistency ( ) except the SR domain in which is acceptable (0.64) (Hawthorne, Herrman, et al., 2006; Serra et al., 2006; Skevington et al., 2004). The SR domain has the least number of items (three) which contributes to the weakness of this domain (O'Carroll, Smith, Couston, Cossar, & Hayes, 2000). Given that SR is a core aspect in this study, the same domain of the WHOQOL-100 (12 items and better internal consistency) is also used in this research (further information about this domain below). All the questions of the WHOQOL-Bref are rated in a five-point Likert scale and the scores are transformed into a zero to 100 scale. Twenty-four (24) of the items are rated, scores for the four domains are calculated, and overall QOL results from the scores of the remaining two questions. All the domains are scored separately. It includes questions such as: How would you rate your quality of life? ; To what extent do you feel your life to be meaningful? ; How satisfied are you with your personal relationships?. The score of each question is from one to five. The higher the score, the better the QOL or the satisfaction with life domains (WHO, 1997). Furthermore, demographic data is also collected by this instrument: age, gender, educational level, marital status, profession, living place and health status (Serra et al., 2006) The World Health Organization Quality of Life Scale social relationships domain, Portuguese version The WHOQOL-100 is the long version of the WHOQOL-Bref with 100 items (Canavarro et al., 2009). It is a self-administered instrument, and similarly to WHOQOL-Bref, interviewer-assisted administration is allowed when necessary (WHO, 1997). All the domains of this instrument have good internal consistency ( ), including the SR domain (0.85), which was the only WHOQOL-100 domain used in this study (see Appendix B). We intended to study the impact of aphasia in SR, and for this purpose we chose to use, additionally, a complete version of this domain (composed of 12 items) with the results compared with those of WHOQOL-Bref SR domain. The questions include the facets of personal relationships (four items), practical social support (four items), and sexual activity (four items) which are rated in a five-point Likert scale. The score of each question is from one to five. The higher the score, the better the satisfaction with SR (WHO, 1997). Brígida Patrício 77
78 Aims and method The Center for Epidemiologic Studies Depression Scale, Portuguese version The CES-D is a self-report depression scale originally designed to measure the frequency of depressive symptoms in general population (Radloff, 1977). It is widely used (Kim et al., 1999; Larsen et al., 2013; Simpson & Carter, 2013) and its psychometric properties are good (Gonçalves & Fagulha, 2004; Radloff, 1977; Simpson & Carter, 2013). It asks about the frequency of symptoms felt in the last week through questions like: I felt that I could not shake off the blues even with help from my family or friends ; I felt that everything I did was an effort ; I felt lonely (see Appendix C). It is composed of 20 items that are scored in a four-point Likert scale between zero and three. The total score may range from zero to 60 and the cut-off point for important depressive symptoms detected is 20. The higher the score, the greater the frequency of depressive symptoms (Gonçalves & Fagulha, 2004; Radloff, 1977). In this study, the version used was the 20 items Portuguese version (Gonçalves & Fagulha, 2004) Sociodemographic datasheet A questionnaire was used to collect additional sociodemographic data regarding occupation, cohabitation and socioeconomic status (see Appendix D) Ethical and sampling procedures Ethical approval was given by an independent Ethics Committee (see Appendix E). The snowball sample technique used in this study consisted of a first round composed of 37 people (primary seeds) from all the 11 Portuguese regions (Minho, Trás-os-Montes, Douro Litoral, Beira Alta, Beira Baixa, Beira Litoral, Ribatejo, Estremadura, Alto Alentejo, Baixo Altentejo, and Algarve) and the two islands (Açores and Madeira). Three primary seeds were identified per region and were asked to participate in the study. Some were not living at that moment in the region or were not able to participate. Questionnaires were distributed in envelopes personally or by post to author s own acquaintances who agreed to participate and they were asked to distribute the questionnaires to other people they knew who met the inclusion criteria. The questionnaires were returned personally or by post in sealed envelopes. Brígida Patrício 78
79 Aims and method All the questionnaires were given inside an open envelope with a data sheet explaining the aims of the study, the procedures required answering questionnaires (e.g. if the person is illiterate, the questionnaires should be read aloud other person), and contacting the author (see Appendix F). Once completed, the questionnaires were given by the participants to the primary seeds in sealed envelopes and were returned personally or by post to the author. The author coded every questionnaire and inserted the data in an electronic database. Five hundred and forty (540) questionnaires were distributed and 313 were returned (58% response rate). Fifty eight (58) questionnaires were not used due to missing data and according to WHO (1996) criteria (when more than 20% of the data is missing from an assessment or when the domains could not be calculated because of missing data). The missing data had no identifiable patterns Statistical Analysis Data was analysed using SPSS 16.0 for Windows. As the WHOQOL-Bref scale is ordinal and the results of overall QOL are based on the responses of two questions (both in a five-point Likert scale), non-parametric tests were used. Descriptive statistics was used to characterize the QOL and SR of Portuguese general population, as well as Spearman s rho coefficient that was used to measure the correlation between QOL and SR and: QOL domains; age; level of education; number of cohabitants; socioeconomic status; emotional status. The Chi-square test was used to evaluate the association between QOL and SR and gender and the Kruskal-Wallis test was used to identify possible differences among QOL and SR according to: living place; marital status; type of cohabitants; occupation; and health status. A regression analysis (stepwise method) was undertaken to identify which variables better explained overall QOL and SR. Regression analysis (stepwise method) was also used to identify the life domains and the SR WHOQOL scales items that better explained overall QOL. Brígida Patrício 79
80 Aims and method Study 2 and study 3 (PWA and caregivers samples) Study design and sample characteristics The studies 2 and 3 are cross-sectional descriptive, correlational and comparative studies. The sample of this study was composed of 25 PWA and 25 caregivers. PWA met the following inclusion criteria: to be 20 years of age or more; to be Portuguese; living in Portugal; to have premorbid European Portuguese language proficiency; to have aphasia following stroke for at least three months; to have good auditory comprehension (outcomes of seven or more in the simple auditory comprehension test of the Lisbon Aphasia Assessment Battery (LAAB)); no known history of cognitive and auditory disabilities that could interfere with the individual s performance in the investigation. The inclusion criteria for the caregivers were to: live in Portugal; be Portuguese; be a native European Portuguese speaker; be with the PWA for at least an average of eight hours per day; and have no history of cognitive disabilities or other that could interfere with language or communication. PWA were recruited from five public hospitals (Centro Hospitalar do Porto Hospital Geral de Santo António; Unidade Local de Saúde de Matosinhos E.P.E. Hospital Pedro Hispano; Hospital Espírito Santo de Évora, E.P.E.; Hospital de Faro, E.P.E.; Centro Hospitalar de Trás-os-Montes e Alto Douro, E.P.E. Unidade Hospitalar de Chaves), one rehabilitation centre (Centro de Medicina de Reabilitação do Sul), and through independent speech and language therapists working with PWA at their dwelling-place. The sample sizes required for high values of tests power and minimal effect sizes were not calculated for study 2 and 3 since the samples sizes are small and the power of the tests are obviously limited by this. We do not want to make inferences to population Measures All the PWA completed the European Portuguese version of the following instruments: WHOQOL-Bref (Serra et al., 2006); the SR domain of the WHOQOL-100 (Canavarro et al., 2009); the CES-D, (Gonçalves & Fagulha, 2004); the Frenchay Activities Index (FAI) (Jesus, Marques, Roberto, Rosa, & Patrício, In Press-b; Wade, Legh-Smith, & Hewer, 1985); the BI (Jesus, Marques, Roberto, Rosa, & Patrício, In Press-a; Mahoney & Barthel, 1965); the Mini-Mental State Modificado (MMSM) (Matos & Jesus, 2011b); the Communication Disability Profile (CDP) (Matos & Jesus, 2011a); the LAAB (Castro-Caldas, 1979; Damásio, 1973; Ferro, 1986); and a demographic data sheet. For this Brígida Patrício 80
81 Aims and method sample, the interviewer assessing the PWA was additionally asked to rate the PWA s completion of the WHOQOL-Bref on a visual analogue scale. The caregivers completed the European Portuguese versions of the: WHOQOL-Bref (Serra et al., 2006); the SR domain of the WHOQOL-100 (Canavarro et al., 2009); the CES-D (Gonçalves & Fagulha, 2004); and the Carer s Assessment of Managing Index (CAMI) (Brito, 2002) The WHOQOL-Bref, the SR domain of the WHOQOL-100 and the CES-D was described in section Frenchay Activities Index, Portuguese version 1 The FAI is composed by 15 items that assesses the frequency of activities performed in the last three and six months in people with stroke (see Appendix G). The activities require some decisionmaking and organisation within and outside home such as In the last three months how often have you undertaken preparing meals? or In the last six months how often have you undertaken travel outing/car ride?. The answers are given in a four-point Likert scale from zero to three (e.g. 0=Never; 1=less than once per week; 2=1-2 times per week; 3=most days). Frequency changes according to the activity and the period of time they are referring to (three or six months). The range is zero to 45. Higher scores reveal higher levels of frequency of activities performed (Wade et al., 1985). There is no Portuguese version of the FAI. Martins, Ribeiro, and Garret (2003) generated an adaptation of this instrument for European Portuguese changing the questions and the Likert scale to assess the way individuals feel about the activities (e.g. 0=unable; 1=lots of difficulty; 2=difficulty; 3=No difficulty) (Martins et al., 2003). Since this is an alteration of the original instrument, we asked the authors of the original instrument to culturally adapt a new Portuguese version, which was granted. The version we used was translated in EP with some minor adaptations made to some wording and expression to be culturally relevant for Portugal, following international guidelines (Beaton, Bombardier, Guillemin, & Ferraz, 1998; Guillemin, Bombardier, & Beaton, 1993; Hutchinson, Bentzen, & Konig-Zahn, 1997; Wild et al., 2005). It is awaiting validation. It is otherwise equivalent to the original instrument. 1 Available from the advanced Communication and Swallowing Assessment (ACSA) platform Brígida Patrício 81
82 Aims and method Barthel Index, Portuguese version 2 The BI was developed to measure functional ability in ADL of adults with neuromuscular or muscular-skeletal disorders (e.g. stroke, spinal cord injuries, rheumatoid arthritis, or amputations). It is composed of 10 subtest items that include: feeding; moving from wheelchair to bed and return; personal grooming; getting on/off the toilet; bathing; walking or propelling a wheelchair; stair climbing; dressing and undressing; bowel; and bladder control (see Appendix H). Subtests scoring range is zero to 15 with increments of five. The maximum total score is 100 and represents the highest level of independence. Lower scores represent greater dependency. The rating scale is completed by an observer or obtained by verbal reports from patients, carers and staff. This instrument is sensitive, has concurrent and predictive validity, is reliable, and has high internal validity (Mahoney & Barthel, 1965; Shinar et al., 1987; Sinoff & Ore, 1997). We asked the authors to culturally adapt this measure, which was granted. The version used was translated in EP with some minor adaptations made to some wording and expression to be culturally relevant for Portugal, following MAPI institute guidelines. It is then equivalent to the original instrument The remaining validation process is being undertaken Mini-Mental State Modificado, Portuguese version 1 In this study we used the Mini-Mental State Modificado (MMSM), Portuguese version (Matos & Jesus, 2011b) of the Language Modified Mini-Mental State (LMMS) by Pashek (2008). The Mini- Mental State Examination (MMSE) (Folstein, Folstein, & McHugh, 1975) has been demonstrated to be a valid and reliable measure for cognitive assessment of older people. The areas assessed by this instrument are: orientation; registration; attention; calculation; recall; language; and figure copying. The instructions are presented orally and the answers are also expected to be conveyed orally (Folstein et al., 1975; Tombaugh & McIntyre, 1992). Pashek (2008) created a languagemodified version (LMMS) that included contextual support and multiple-choice response options, which could be used by PWA. Items such as orientation, auditory-verbal recall (modified for visual recall), attention, language, figure copy subtests were modified to multiple-choice options (six 2 Available from the Patient-Reported Outcome and Quality of Life Instruments Database (PROQOLID) Brígida Patrício 82
83 Aims and method options), written words, and/or picture support. Additionally, the language subtest was adapted for patients with hemiplegia since this subtest required the use of both hands and many PWA have hemiparesis or hemiplegia (Pashek, 2008). The Portuguese version used colour photos, while the original LMMS used black and white line drawings (Matos & Jesus, 2011b; Pashek, 2008). Each item is scored as one if the answer is correct or zero if it is incorrect. The scoring range is zero to 30. Cognitive deficit is identified if the total score is less than 15 for non-educated people, less than 21 for people with one to 11 years of education, and less than 26 for those with more than 11 years of education (Matos & Jesus, 2011b) Communication Disability Profile, Portuguese version 1 The Communication Disability Profile (CDP) (see Appendix J) is an instrument that measures the impact of stroke and aphasia in PWA s activities, participation and emotional status according to their views. It enables the PWA to respond according to his perspective despite his access to written language using accessible pictures and culturally relevant pictorial rating scales (Swinburn & Byng, 2006). Its known psychometric properties are good for activities and participation (Cronbach s alpha>0.8; and Cronbach s alpha>0.7) and weaker for emotions (Cronbach s alpha=0.59) (Chue, 2008). It has four subtests: Activities, Participation, External influences and Emotions with many items scored zero to four (five-point Likert scale, e.g. during the last week how easy is it to talk to strangers ). The Activities subsection has 20 scored items regarding speech, communication, auditory comprehension, reading, and writing; the Participation subsection has 13 scored items regarding social participation; and Emotion has 14. The External influences are not scored, but the barriers and facilitators for the PWA are identified (e.g. What helps? ). Subsections can be analysed and calculated independently. In this study Activities and Participation are analysed separately. Higher scores represent lower levels of activities and participation (Matos & Jesus, 2011a; Swinburn & Byng, 2006) Lisbon Aphasia Assessment Battery The participants were assessed with the Lisbon Aphasia Assessment Battery (LAAB) (Castro- Caldas, 1979; Damásio, 1973; Ferro, 1986) on fluency, naming, simple auditory comprehension and word repetition tasks to diagnose the type of aphasia and to determine the aphasia coefficient (see Brígida Patrício 83
84 Aims and method Appendix K). The fluency is classified according to type and level: fluent, non-fluent and within a range of zero to five. Higher values in the fluency or non-fluency scales represent a better speech performance. The naming task involves 16 real world objects. If the subject names the object successfully the score is one; if he does it incorrectly the score is zero. Less than 16 points represents naming difficulties. The simple auditory comprehension task includes eight instructions. The minimum score is zero, the maximum is eight and the cut-off point for good simple auditory comprehension is seven. If the subject performs each task correctly at the first time the score is one, if not but does on a second chance, the score is 0.5. If it is performed incorrectly twice the score is zero. The repetition task is composed of 30 words. If the individual does it correctly the score is one, if he does not, the score is zero. The cut-off point for good repetition is 23. Type of aphasia is diagnosed based on fluency analysis, and naming, simple auditory comprehension and repetition difficulties. Aphasia coefficient is determined through the sum of all these results divided by four. The final result is transformed in a percentage (Castro-Caldas, 1979; Damásio, 1973; Ferro, 1986) Carers Assessment of Managing Index, Portuguese version The Carers Assessment of Managing Index (CAMI) assesses the coping strategies used by the caregivers and how useful they prove to be (Nolan, Keady, & Grant, 1995; Oyebode, 2003) (see Appendix L). It was developed by Nolan et al. (1995) and the version used in this study was the Portuguese version by Brito (2002) that showed good internal consistency (0.80) (Barbosa, Figueiredo, Sousa, & Demaind, 2011; Brito, 2002). It has 38 items divided into three categories: problem solving strategies; emotional-cognitive strategies; dealing with the consequences of stress. The answers are given in a four-point Likert scale whether they do not apply, apply but do not find helpful, apply and find it quite helpful or apply and find it very helpful. Higher scores reveal more helpful strategies are used by participants (Barbosa et al., 2011; Brito, 2002) Sociodemographic datasheet A questionnaire was used to collect additional sociodemographic data regarding occupation, cohabitation, socioeconomic status, and sick leave from work by doctors orders. The socioeconomic status was assessed using the European Society for Social, Opinion and Market Research (ESOMAR) indicators (Cabral, 1995a, 1995b; Reif, Marbeau, Quatresooz, & Vancraeynest, Brígida Patrício 84
85 Aims and method 1991) by asking the occupational group and educational level of the person with greater financial income for the family (Cabral, 1995a, 1995b; Reif et al., 1991). Regarding PWA, they were additionally asked about speech and language therapy data (if they have or had speech and language therapy and for how long) (see Appendix M), and concerning caregivers, the additional questions were about the amount of time caregivers spent with the PWA (see Appendix N) Interviewers experience of using the WHOQOL-Bref tool The data was collected by the researcher or the speech and language therapist working with the PWA (see section ). The interviewers assessing PWA were asked to complete a visual analogue scale from zero to 10 (0=easy or any help; 10=difficult or great amount of help) to analyse the experience of using WHOQOL-Bref with PWA. Instruments should be easy to understand, to respond, and should be time efficient (Cruice, Hirsch, et al., 2000), so five questions were asked to the interviewers (see Appendix O): how easy it was for PWA to understand the WHOQOL-Bref; how easy it was to respond to the WHOQOL-Bref; the amount of help PWA needed; the overall use of the instrument; and the time spent with PWA to administer the WHOQOL-Bref Ethical and sampling procedures Authorization for data collection was asked in 10 Portuguese institutions (north, centre, south of Portugal and islands): nine hospitals, and one rehabilitation centre attended by PWA. Before asking formally for authorization, a contact through telephone was made to make sure that those institutions attended by PWA. From those, six responded positively to our request (three in the north, one in the centre and two in the south of Portugal) (see Appendix P). Ethical approval was given by the ethics committees, the administrations and medical services directors of the institutions involved. Some cases were identified through independent speech and language therapists working in PWA s dwelling-place. The data was collected all over the country by the researcher or by the local speech and language therapist (according to the rules and requirements of the institutions). All the documents were delivered personally by the researcher to the local speech and language therapist involved in the study. All the instruments were shown, explained, and role-playing sessions were performed to practice the administration of instruments. Instruments were completed in the following order: LAAB, MMSM, WHOQOL-Bref, WHOQOL-100 SR domain, CES-D, BI, FAI, CDP, CAMI and Brígida Patrício 85
86 Aims and method sociodemographic datasheet. Every three weeks the researcher contacted the speech and language therapists to check the data collection progress or to clarify any queries. Every set of documents for the speech and language therapists had a cover letter, a checklist of all the material (see Appendix Q) and a data sheet clarifying procedures (e.g. envelopes codification) (see Appendix R) and some general instructions for instruments use (e.g., the use of total communication if necessary, only) (see Appendix S). All participants were given written information on the study (see Appendix T and U) that was read aloud by the speech and language therapist and written consent was obtained (see Appendix V and W). After answering to all the questions/instruments, all the information was sealed in coded envelopes according to the instructions given. The consent forms were kept in separate envelopes. Once completed, the questionnaires were returned to the researcher by the speech and language therapist Statistical Analysis Data was analysed using SPSS 16.0 for Windows. Similar to study 1, as the WHOQOL-Bref scale is ordinal and the results of overall QOL are based on the responses of two questions (both in a fivepoint Likert scale), non-parametric tests were used. Descriptive statistics were used to characterise the QOL and SR of PWA and caregivers, as well as Spearman s rho coefficient that was used to measure the correlation between QOL and SR and: QOL domains; age; level of education; number of cohabitants; socioeconomic status; emotional status, time post stroke; aphasia coefficient; activities; participation; cognition; time after discharge, SLT time; time they left SLT and coping. The Kruskal-Wallis test was used to identify possible differences among QOL and SR according to: gender; living place; marital status; type of cohabitants; occupation; health status; type of motor impairment; aphasia etiology; having speech and language therapy currently or in the past. A regression analysis (stepwise method) was undertaken to identify which variables better explained overall QOL and SR (including life domains and SR WHOQOL items). The hierarchy boxes method was used in the linear regression to hierarchize the variables selected whether they were from the sample s significant correlations or from previous knowledge such as general population correlations results and/or literature. Correlations (Spearman s rho coefficient) and regression analysis were also used to verify the items of the SR domains that had stronger correlations with SR results, that better predicts it, and the SR domains that better explain overall QOL. Brígida Patrício 86
87 Aims and method The Mann-Whitney test was used to compare groups results (PWA, caregivers and control groups). First comparisons among groups were undertaken through visual inspection of the QOL and SR means. After that, a carefully matched sample was selected to do more feasible comparisons and to detect significant differences in the findings using the Mann-Whitney test. Acknowledging that is not appropriate to compare a sample of 255 with samples of 25 individuals, a smaller proportion of general population was selected to do comparisons. A data reduction procedure was designed matching age, gender, and educational level. All the subjects were analysed and those with the same characteristics of PWA and caregivers (concerning age, gender and educational level) were selected to two new and smaller groups of general population (from here on called control groups). Whilst one-to-one matching is typically used, in this study 20% of the large sample was selected to maintain the heterogeneity in QOL data (variable of our concern). Fifty (50) healthy individuals were selected as PWA s control group and other 50 for the caregivers control group. When the characteristics were not the same, the most similar individuals were selected. When we obtained more than two healthy participants per person with aphasia or per caregiver, a random technique was used to select the individuals to take part in the reduced sample. Descriptive statistics were used to evaluate the experience of completing WHOQOL-Bref from speech and language therapists perspectives of easy of understanding and responding, assistance required and length of administration. Brígida Patrício 87
88 Results CHAPTER 4: Results This chapter is organised in topics according to study 1 (Portuguese general population sample), study 2 (PWA sample) and study 3 (caregivers sample) to facilitate navigation through the results, and to ensure organised presentation and statistical analysis. Given the amount of data of the studies and to facilitate navigation through the results some tables are shown in appendixes. The most important information of the tables in appendix is reported in the body of the text. The most relevant data tables were kept in this chapter Study 1 (Portuguese general population sample) Participants were aged 25 to 84 years, with a mean age of 43 years. The majority of the participants was female (58%), had university level of education (37%), was employed (82%), was married or lived with a partner (69%), and reported themselves as healthy (91%) (see Table 9). The mean for emotional status of Portuguese general population was 12.38±8.10. Table 9: Demographic data (N=255) Range Mean ± SD Age ± n Percentage (%) Gender Male Female Educational level Illiterate years years years years University Postgraduate Occupation Employed Unemployed Retired Living Place Mainland Islands Marital status Single Married/Partner Separated/Divorced Widow/widower Brígida Patrício 88
89 Results Table 9: Demographic data (N=255) (continued) Number of cohabitants Type of cohabitants Socioeconomic status n Percentage (%) Alone Alone Partner Partner & Children Parent(s) Other High Medium-high Medium Medium-low Low Health* Unhealthy Healthy * Healthy and unhealthy status was determined by people responding to the WHOQOL-Bref s question Are you currently ill? ; illness = unhealthy. The majority of the sample was from Douro Litoral (13%) and Açores (12%) followed by Beira Litoral (10%) and Estremadura (9%) (see Table 10). Table 10: Regional distribution (N=255) Region* Frequency Percent Valid Percent Cumulative Percent Minho Trás-os-Montes Douro litoral Beira Alta Beira Litoral Beira Baixa Ribatejo Estremadura Alto Alentejo Baixo Alentejo Algarve Brígida Patrício 89
90 Results Table 10: Regional distribution (N=255) (continued) Region* Frequency Percent Valid Percent Cumulative Percent Madeira Açores Total *Regions are presented by geographical order Quality of life of Portuguese general population In general, participants considered their QOL as good (mean=71.81) and scored highest in the physical domain, followed by psychological, SR and environmental domains. All the domains are qualitatively classified as good (see Table 11). Table 11: Overall QOL and domains means N Range Mean Std. Deviation Overall QOL Physical domain Psychological domain SR domain Environmental domain Regarding the influence of QOL domains, every domain correlated significantly with overall QOL and the one that had the higher correlation was the physical domain (ρ=0.56, p=0.000) followed by psychological (ρ=0.50, p=0.000) and environment (ρ=0.45, p=0.000) domains, all of them with moderate associations. The SR domain had a weak but significant correlation with overall QOL (ρ=0.34, p=0.000) (see Appendix X, table X.1). The correlation between overall QOL and the WHOQOL-100 SR domain is also statistically significant and weak (ρ=0.37; p=0.000) (see Appendix X, Table X.2), however it is marginally stronger than its Bref SR domain counterpart. Regarding overall QOL and demographic variables correlations, overall QOL had a weak but significant and negative correlation with age (ρ=-0.27, p=0.000), socioeconomic status (ρ=-0.14, Brígida Patrício 90
91 Results p=0.024) and emotional status (ρ=-0.34, p=0.000), and positive with educational level (ρ=0.33, p=0.000). Younger people had better QOL, as well as people with higher levels of education, higher socioeconomic status and less depressive symptoms. The number of cohabitants (ρ=0.02, p=0.817) and gender (χ 2 =0.75) did not correlate with overall QOL (See Appendix X, Tables X.3 and X.4). People living in the mainland and islands had significantly different QOL, as well as people with different marital status, different type of cohabitants, different occupations, and health status (see Table 12). Table 12: Kruskal-Wallis test results for overall QOL and living place, marital status, type of cohabitants, occupation and health Overall QOL Living place Chi-Square Df 1 Asymp. Sig Marital Status Chi-Square Df 5 Asymp. Sig Type of cohabitants Chi-Square 9.75 Df 4 Asymp. Sig Occupation Chi-Square Df 2 Asymp. Sig Health Chi-Square Df 1 Asymp. Sig Single people had better overall QOL than the other marital status groups (see Table 13). People living with parents showed better overall QOL scores; the other groups had quite similar mean scores. People living on the islands had better QOL than those who lived on the mainland. People who were employed had better QOL than unemployed and retired participants. Retired individuals had the worst or lowest QOL. Healthy people had much better QOL scores than the unhealthy group (see Table 13). The reader will also note on Table 13 that, although there is no significant gender correlation with QOL, females had better QOL results than males. The age group with better QOL was the youngest (24-44 years). People with better emotional health also had higher QOL means. People with postgraduate educational level had better QOL than the other educational level groups. Brígida Patrício 91
92 Results Regarding socioeconomic status, the group designated as High had the best overall QOL scores and those with Low socioeconomic status had the worst QOL (see Table 13). Regarding QOL domains, the physical domain had the highest scores among almost all groups and the environment the lowest. The psychological domain was scored the highest for males, participants with seven to nine years of education/schooling, those separated/divorced, those living with partner, and those retired. The SR domain was scored the highest for illiterate and unhealthy groups; and the physical domain was scored the lowest by these same two sub-groups (see Table 13). It should be acknowledge that illiterate and widower subgroups have small numbers (illiterate n=3, widower n=9) and this may influence the results. Brígida Patrício 92
93 Results Table 13: Overall QOL and domains descriptive data Overall QOL Physical Domain Psychological Domain SR Domain Environmental Domain n Mean SD Mean SD Mean SD Mean SD Mean SD Gender Male Female Age (years) (years) Emotional status Educational level Socioeconomic status (years) Good Depressive Symptoms Illiterate years years years years University Postgraduate High Medium-high Medium Medium-low Low Marital status Single Married/Partner Separated/Divorced Widower For overall QOL minimum and maximum underlined. Across all domains and for each subgroup (male, female,, parent(s), other) minimum values in italic and maximum values in bold. Brígida Patrício 93
94 Results Type of cohabitants Table 13: Overall QOL and domains descriptive data (continued) Physical Domain Psychological Domain SR Domain Environmental Domain Overall QOL n Mean SD Mean SD Mean SD Mean SD Mean SD Alone Partner Partner & Children Parent(s) Other Living Place Mainland Islands Occupation Employed Unemployed Retired Health Unhealthy Healthy For overall QOL minimum and maximum underlined. Across all domains and for each subgroup (male, female,, parent(s), other) minimum values in italic and maximum values in bold. Brígida Patrício 94
95 Results In the presence of all WHOQOL-Bref domains, overall QOL was better predicted by the physical domain (37.5%), followed by the psychological domain (together they predicted 42.4%). The SR domain was not a significant predictor of overall QOL for the Portuguese general population sample (see Table 14). Table 14: QOL domains as predictors of overall QOL Linear regression (stepwise) ANOVA(d) Model R R Square Model df F Sig a ; a b ; b c ; c a. Predictors: (Constant), Physical domain b. Predictors: (Constant), Physical domain, Psychological domain c. Predictors: (Constant), Physical domain, Psychological domain, Environmental domain d. Dependent Variable: Overall QOL Among age, emotional status, educational level, socioeconomic status, and number of cohabitants, emotional status was the best predictor of QOL, explaining 13% of the variance of QOL results. This variable, along with educational level and age, altogether, explained 25% of overall QOL results. Socioeconomic status was not considered a significant predictor of QOL (see Table 15). Linear Regression (stepwise) Table 15: Demographic predictors of overall QOL ANOVA(d) Model R R Square df F Sig a ; b ; c ; a. Predictors: (Constant), Emotional status b. Predictors: (Constant), Emotional status, Education level c. Predictors: (Constant), Emotional status, Education level, Age d. Dependent variable: Overall QOL Social relationships of Portuguese general population The results of Portuguese general population sample revealed that they are satisfied with their SR (Mean=73.69) as shown in Table 11. Age (ρ=-0.15, p=0.021), educational level (ρ=0.16, p=0.012) and emotional status (ρ=-0.45, p=0.000) influenced SR satisfaction of Portuguese general population. All these correlations were also verified with the SR domain of WHOQOL-100, although slightly higher values were obtained. Brígida Patrício 95
96 Results Socioeconomic status (p=0.082; p=0.053) and number of cohabitants (p=0.475; p=0.962) do not correlate with any SR domain (see Table 16). People living in the mainland or islands (p=0.013) had significantly different satisfaction with their SR, as well as people with different occupations (employed, unemployed and retired) (p=0.042) (see Table 17). Looking at Table 13 we can see that people living in the islands (mean=78.10) and people that are employed (mean=74.96) were more satisfied with their SR. Table 16: SR domains correlations Correlations (Spearman s rho) SR WHOQOL-Bref SR WHOQOL-100 Age Correlation Coefficient * ** Sig. (2-tailed) N Education Level Correlation Coefficient 0.158* 0.214** Sig. (2-tailed) N Socioeconomic Correlation Coefficient Status Sig. (2-tailed) Number of cohabitants Emotional Status N Correlation Coefficient Sig. (2-tailed) N Correlation Coefficient ** ** Sig. (2-tailed) N *. Correlation is significant at the 0.05 level (2-tailed). **. Correlation is significant at the 0.01 level (2-tailed). Brígida Patrício 96
97 Results Table 17: Kruskal-Wallis test results for SR of WHOQOL-Bref and living place, marital status, type of cohabitants, occupation and health SR WHOQOL-Bref Living place Chi-Square Df 1 Asymp. Sig Marital status Chi-Square Df 5 Asymp. Sig Type of cohabitants Chi-Square Df 4 Asymp. Sig Occupation Chi-Square Df 2 Asymp. Sig Health Chi-Square Df 1 Asymp. Sig From all the variables studied (age, educational level, socioeconomic status, number of cohabitants and emotional status), emotional status and age were the best predictors of SR satisfaction. Emotional status explained 24% of variance in SR results. Together, emotional status and age explain 26% of overall results (See Appendix X, Table X.5) Both SR domains were introduced in a linear regression model. In the presence of WHOQOL- 100 RS, the WHOQOL-Bref SR domain was not considered a significant predictor of QOL (even though correlations shown are similar: SR WHOQOL-Bref ρ=0.34, p=0.000; SR WHOQOL-100 ρ=0.37, p=0.000). WHOQOL-100 SR predicted 13% of overall QOL. This regression analysis is significant (p=0.000) (see Appendix X, Table X.6). All the items of WHOQOL-Bref SR domain had a significant and strong correlation with the domain overall results. The item with highest correlation was item 21 (How satisfied are you with your sex life?) (ρ=0.82, p=0.000), followed by item 22 (How satisfied are you with the support you get from your friends?) (ρ=0.77, p=0.000), and item with the lowest correlation coefficient was item 20 (How satisfied are you with your personal relationships?) (ρ=0.76, p=0.000). Although, the strength of the correlations is very similar, especially regarding items 22 and 20 (see Appendix X, Table X.7). Brígida Patrício 97
98 Results Concerning WHOQOL-100 SR domain correlations, every item had a significant correlation (strong to moderate) with the overall results of the domain. The items with the strongest correlations were: item 10 (How satisfied are you with your ability to provide for or support others?) (ρ=0.81, p=0.000); item 5 (To what extent can you count on your friends when you need them?) (ρ=0.72, p=0.000); item 9 (How satisfied are you with the support you get from your friends?) (ρ=0.72, p=0.000) (see Table 18). From these questions, only item 9 is part of WHOQOL-Bref (item 22). Table 18: SR WHOQOL-100 domain total score and its items correlation Correlations (Spearman's rho) WHOQOL-100 SR Domain Item 1 Item 2 Item 3 Item 4 Item 5 Correlation Coefficient ** 0.607** 0.556** 0.658** 0.719** WHOQOL-100 Sig. (2-tailed) SR Domain N Item 6 Correlation Coefficient 0.663** Sig. (2-tailed) N 255 Item 7 Correlation Coefficient 0.690** Sig. (2-tailed) N 255 Item 8 Correlation Coefficient 0.668** Sig. (2-tailed) N 255 Item 9 Correlation Coefficient 0.716** Sig. (2-tailed) N 255 Item 10 Correlation Coefficient 0.814** Sig. (2-tailed) N 255 Item 11 Correlation Coefficient 0.677** Sig. (2-tailed) N 255 Item 12 Correlation Coefficient 0.684** Sig. (2-tailed) N 255 ** Correlation is significant at the 0.01 level (2-tailed) Items 6, 7 and 9 take part in WHOQOL-Bref Regarding SR predictors, item 21 (How satisfied are you with your sex life?) of the WHOQOL- Bref predicts 67% of the variance of overall SR WHOQOL-Bref results, followed by item 22 (How Brígida Patrício 98
99 Results satisfied are you with the support you get from your friends?), and together both items explain 90%. All regression analysis were significant (p=0.000) (see Appendix X, Table X.8). Among the 12 items of WHOQOL-100 SR, item 10 (How satisfied are you with your ability to provide for or support others?) strongly predicted WHOQOL-100 SR results (67%), followed by item 7 (How satisfied are you with your sex life?), item 5 (To what extent can you count on your friends when you need them?), item 11 (Do you feel happy about your relationship with your family members?), and item 1 (How alone do you feel in your life?). Together, these five items, explained 95% of the variance of WHOQOL-100 SR results. All regression analyses were significant (p=0.000) (see Appendix X, Table X.9) Brief summary of study 1 results: People from Portuguese general population consider their QOL as good and are satisfied with their SR. Age, socioeconomic status, educational level and emotional status are significantly correlated with overall QOL; living in mainland or islands, marital status, type of cohabitants, occupation and health status also seem to influence QOL; and emotional status is the best predictor of QOL. Age, educational level and emotional status are also significantly correlated with SR results; and living in mainland or islands and different occupations also seems to influence SR satisfaction. Likewise for QOL, emotional status is the best predictor for SR s satisfaction. In the presence of WHOQOL-100 SR domain, the same domain of WHOQOL-Bref is not a predictor of Portuguese general population QOL Study 2 (People with aphasia sample) The PWA were aged 20 to 71 years, with a mean age of 54 years. The majority were male (52%), had one to four or 10 to 12 years of education (24% each), were retired (52%), were married or had a partner (84%), lived with the partner and children (40%), were from a medium-low socioeconomic status (48%), and reported themselves as healthy (96%). All PWA were from mainland, and the majority was from a region called Douro Litoral (52%) (see Table 19). Brígida Patrício 99
100 Results Table 19: PWA sociodemographic data (N=25) Range Mean ± SD Age ± n Percentage (%) Gender Male Female Illiterate years years Educational level 7-9 years years University Postgraduate Occupation Employed Unemployed Retired Volunteer Student Living place Trás-os-Montes e Alto Douro Douro Litoral Beira Litoral Alto Alentejo Algarve Marital status Single Married/Partner Separated/Divorced Widow/widower Number of cohabitants Type of cohabitants Partner Partner & Children Parent(s) Sibling(s) Parent(s) & Sibling(s) Other Brígida Patrício 100
101 Results Table 19: PWA sociodemographic data (N=25) (continued) n Percentage (%) High Medium-high Socioeconomic status Medium Medium-low Low Health* Unhealthy Healthy * Healthy and unhealthy status was determined by people responding to the WHOQOL-Bref s question Are you currently ill? ; illness = unhealthy. The majority of the participants with aphasia had speech and language therapy at the time of data collection (76%) and had hemiparesis (64%). The diagnosis of aphasia were Anomic aphasia (24%), Conduction aphasia (24%), Broca s aphasia (24%) and Transcortical Motor aphasia (28%). They had a mean of 27 months post-stroke and an average of aphasia coefficient of (see Table 20). Table 20: PWA stroke and aphasia data n Percentage (%) Speech and Currently language therapy Past Motor impairment Hemiparesis Sensibility No impairment Type of aphasia Anomic Conduction Broca Transcortical motor Range Mean ± SD Aphasia coefficient ±16.80 Time post-stroke (months) ± Quality of life of people with aphasia The PWA showed an average of QOL between bad and neither good nor bad (mean=41), which is lower than for Portuguese general population (mean=72). The QOL domain with the lowest score was the SR, followed by the physical and psychological domain. The domain with the highest score was the environment. All the domains were qualitatively classified as neither satisfied nor dissatisfied (see Table 21). Brígida Patrício 101
102 Results Table 21: Overall QOL and domains means for PWA N Range Mean Std. Deviation Overall QOL Physical domain Psychological domain SR domain Environmental domain All QOL domains were significantly correlated with overall QOL. All the correlations were strong. The physical domain had the strongest correlation (ρ=0.87, p=0.000) and the SR domain the weakest (ρ=0.79, p=0.000), although still strong (see Table 22). All the correlations are stronger than those verified for Portuguese general population and for the caregivers. Table 22: PWA overall QOL correlations with QOL domains (WHOQOL-Bref) Correlations (Spearman's rho) Physical Psychological SR Environment Overall QOL Correlation Coefficient 0.870** 0.829** 0.787** 0.853** Sig. (2-tailed) N ** Correlation is significant at the 0.01 level (2-tailed) Concerning the correlation between overall QOL and the WHOQOL-100 SR domain, it was statistically significant and strong (ρ=0.72, p=0.000) (see appendix y, Table Y.1) but a little lower than the one observed for the same domain of WHOQOL-Bref (ρ=0.79 p=0.000) (see Table 22). The QOL of PWA was significantly correlated with emotional status (ρ=-0.56, p=0.003) and education level (ρ=0.46, p=0.021). The correlation with emotional status is negative and moderate, which means that the higher the depressive symptoms the worse the QOL (see Table 23). Regarding education level, the higher the education level, the better the QOL. These correlations were stronger than those of Portuguese general population group. The other sociodemographic variables studied did not correlate significantly with QOL. Brígida Patrício 102
103 Results Table 23: PWA overall QOL correlations with age, educational level, socioeconomic status, number of people living with and emotional status Overall QOL Correlations (Spearman's rho) Education Socioeconomic Age Level Status Number of cohabitants Emotional Status Correlation Coefficient * ** Sig. (2-tailed) N *. Correlation is significant at the 0.05 level (2-tailed). **. Correlation is significant at the 0.01 level (2-tailed). The Kruskal-Wallis test revealed that there were no differences in overall QOL regarding gender (p=0.457), marital status (p=0.964), type of cohabitants (p=0.955), occupation (p=0.344) and health (p=0.182) for PWA (see Appendix Y, Table Y.2). Overall QOL of PWA was additionally significantly correlated with the activities measured by the BI (ρ=0.55, p=0.005), FAI (ρ=0.68, p=0.000), CDP activities (ρ=-0.73, p=0.000), and CDP participation (ρ=-0.77, p=0.000) of PWA. The correlations were strong to moderate and revealed that the more activities or participation the PWA were involved in, the better their QOL. The strongest correlation was with participation (see Table 24). Table 24: PWA correlations of overall QOL with: time post-stroke, aphasia coefficient, activities (BI, FAI and CDP), participation (CDP) and cognition (MMSM) Correlations (Spearman's rho) Overall QOL Time poststroke coefficient (BI) Aphasia Activities Overall QOL Correlation Coefficient ** Sig. (2-tailed) N Activities (FAI) Correlation Coefficient 0.680** Activities (CDP) Participation (CDP) Cognition (MMSM) Sig. (2-tailed) N 25 Correlation Coefficient ** Sig. (2-tailed) N 25 Correlation Coefficient ** Sig. (2-tailed) N 25 Correlation Coefficient Sig. (2-tailed) N 25 **. Correlation is significant at the 0.01 level (2-tailed). *. Correlation is significant at the 0.05 level (2-tailed). Brígida Patrício 103
104 Results PWA s overall QOL did not correlate with the time they were discharged from hospital (p=0.508), with speech and language therapy time (p=0.343) or the time they stopped speech and language therapy (p=0.231) (see Appendix Y, Table Y.3). The Kruskal-Wallis test also revealed that there are no differences in overall QOL regarding the type of motor impairment (p=0.087), aphasia etiology (p=0.462) and currently having speech and language therapy or finished speech and language therapy (p=0.107) (see Appendix Y, table Y.4). Regarding domains as QOL predictors, the physical domain was the best predictor of PWA s overall QOL (76%), followed by the environmental domain (together they explain 81%) (see Appendix Y, Table Y.5). For PWA, in the presence of WHOQOL-Bref SR domain, the same domain of the WHOQOL-100 is not a predictor of overall QOL. In this linear regression, the WHOQOL-Bref SR domain explains 61% of the variance of overall QOL results (see Appendix Y, Table Y.6). Considering the significantly correlated variables with PWA s and Portuguese general population s QOL, as well as the variables significantly correlated with PWA s QOL described in the literature (educational level, emotional status, activities measured by BI, FAI and CDP, participation, age, socioeconomic status and time post-stroke), we used a linear regression with a three block method. From all these variables, participation explained 55% of the results, followed by emotional status, and together explained 63%. Participation was the strongest predictor (see Appendix Y, Table Y.7) Social relationships of people with aphasia The average of PWA s SR showed that PWA are neither satisfied nor dissatisfied with their SR (mean=51) as can be seen in Table 21, which is a lower result than for Portuguese general population (mean=74). SR domains of both WHOQOL-Bref and WHOQOL-100 had significant correlations with emotional status (Bref SR ρ=-0.42, p=0.037; 100 SR ρ=-0.57, p=0.003), BI activities (Bref SR ρ=0.45, p=0.025; 100 SR ρ=0.49, p=0.014), FAI activities (Bref SR ρ=0.60, p=0.001; 100 SR ρ=0.66, p=0.000); CDP activities (Bref SR ρ=-0.67, p=0.000; 100 SR ρ=-0.68, p=0.000), and participation (Bref SR ρ=-0.71, p=0.000; 100 SR ρ=-0.70, p=0.000). WHOQOL-100 SR domain correlated additionally with aphasia coefficient (Bref SR ρ=0.40, 100 SR p=0.049). The better the emotional state, the more activities and the more participation, the higher the satisfaction with SR. Individuals with higher language functioning also have higher levels of satisfaction with SR. The Brígida Patrício 104
105 Results strongest correlation was with the variable participation (see Table 25). The SR domain of both instruments did not correlate significantly with age (Bref SR p=0.31; 100 SR p=0.625), educational level (Bref SR p=0.059; 100 SR p=0.053), socioeconomic status (Bref SR p=0.16; 100 SR p=0.33) or number of cohabitants (Bref SR p=0.253; 100 SR p=0.219) (see Appendix Y, Table Y.8). Furthermore, time after discharge (p=0.97; p=0.831), duration of speech and language therapy (p=0.45; p=0.270) and the time they left speech and language therapy (p=0.22; p=0.544), did not correlate to any of the SR domains (see Appendix Y, Table Y.9). Table 25: PWA correlations of overall SR domains (WHOQOL-Bref and WHOQOL-100) and: time post-stroke, emotional status, aphasia coefficient, activities (BI, FAI and CDP), participation and cognition Correlations (Spearman's rho) WHOQOL-Bref SR WHOQOL-100 SR WHOQOL -Bref SR WHOQOL- 100 SR Time poststroke Emotional Status Aphasia coefficient Correlation Coefficient ** * Sig. (2-tailed) N Correlation Coefficient 0.901** ** 0.398* Sig. (2-tailed) N Activities (BI) Correlation Coefficient 0.447* 0.485* Sig. (2-tailed) N Activities (FAI) Correlation Coefficient 0.602** 0.659** Sig. (2-tailed) N Activities (CDP) Participation (CDP) Correlation Coefficient ** ** Sig. (2-tailed) N Correlation Coefficient ** ** Sig. (2-tailed) N Cognition Correlation Coefficient (MMSM) Sig. (2-tailed) N **. Correlation is significant at the 0.01 level (2-tailed). *. Correlation is significant at the 0.05 level (2-tailed). For both the WHOQOL-Bref and WHOQOL-100 SR domains, no differences were found regarding gender (Bref SR p=0.85; 100 SR p=0.354), marital status (Bref SR p=0.41; 100 SR p=0.248), type of cohabitants (Bref SR p=0.71; 100 SR p=0.417), occupation (Bref SR p=0.27; 100 SR p=0.233), Brígida Patrício 105
106 Results health (Bref SR p=0.26; 100 SR p=0.532), motor impairment (Bref SR p=0.40; 100 SR p=0.199), aphasia etiology (Bref SR p=0.98; 100 SR p=0.808) or currently having speech and language therapy or not (Bref SR p=0.95; 100 SR p=0.848) (see Appendix Y, Table Y.10). To determine the predictors of PWA s SR, the variables that correlated with PWA s and general population s SR were considered (emotional status, activities measured by BI, FAI, and CDP, CDP participation, age and educational level). The variable that better explains the variance of the results was the participation (47%), followed by age (together explained 58%) (see Appendix Y, Table Y.11). As shown previously, the WHOQOL-Bref SR domain is a better predictor of overall QOL result in PWA s group (61%) than the same domain of the WHOQOL-100. The WHOQOL-Bref item with the highest correlation with the SR domain was item 22 (How satisfied are you with the support you get from your friends?) (ρ=0.92, p=0.000), followed by item 21 (How satisfied are you with your sex life?) (ρ=0.86, p=0.000) and item 20 (How satisfied are you with your personal relationships?) (ρ=0.81, p=0.000). All the correlations were significant and strong (see Appendix Y, Table Y.12). Regarding WHOQOL-100 SR items, the greatest correlations were those observed for items 6 (How satisfied are you with your personal relationships?) (ρ=0.89, p=0.000), item 9 (How satisfied are you with the support you get from your friends?) (0.87, p=0.000) and item 5 (To what extent can you count on your friends when you need them?) (p=0.86, p=0.000). The item with the weakest correlation was item 2 (How well are your sexual needs fulfilled?) (ρ=0.57, p=0.007) (see Appendix Y, table Y.13). A linear regression with WHOQOL-Bref items showed that item 22 (How satisfied are you with the support you get from your friends?) explained 87% of SR results, followed by item 21 (How satisfied are you with your sex life?) (together explained 94%) and item 20 (How satisfied are you with your personal relationships?) (all explained 99%) (see Appendix Y, Table Y.14). Concerning WHOQOL-100 SR domain, the best predictors were items 5 (To what extent can you count on your friends when you need them?) (79%), followed by item 3 (Are you bothered by any difficulties in your sex life?) (92%) and item 6 (How satisfied are you with your personal relationships?) (all explained 94%) (see Appendix Y, Table Y.15). Brígida Patrício 106
107 Results People s with aphasia and Portuguese general population s overall quality of life and social relationships comparisons To better compare our PWA results with Portuguese general population (control sample) we used a procedure to reduce the control sample to 50 individuals as similar as possible to PWA sample regarding gender, age and educational level. The same procedure was undertaken for caregivers. As a result of this procedure, the demographic data of the new group is shown in Table 26. The data of PWA is also shown in order to facilitate the comparison among samples. Gender is equally distributed and age and educational level have similar results (see Table 26). There are no significant differences regarding age (p=0.840) and educational level (p=0.814) for these samples (see Appendix Y, Tables Y.16 and Y.17). Table 26: Descriptive statistics of the control group and PWA group Control group (N=50) PWA (N=25) n % n % Gender Male Female Range Mean ± SD Range Mean ± SD Age ± ± Education Level ± ± 1.57 The Mann-Whitney test showed that there were significant differences among groups concerning overall QOL (p=0.000), and SR (p=0.0025) (see Table 27). PWA were less satisfied with their QOL, and with their SR than Portuguese general population (see Table 28). Table 27: Mann-Whitney test results for overall QOL and SR comparison between groups (control and PWA) Overall QOL Mann-Whitney U Wilcoxon W Z Asymp. Sig. (One-tailed) SR WHOQOL-Bref Mann-Whitney U 376 Wilcoxon W 701 Z Asymp. Sig. (One-tailed) a. Grouping Variable: Group Brígida Patrício 107
108 Results Table 28: Descriptive statistics for overall QOL, and SR domain Control group (N=50) PWA (N=25) Range Mean ± SD Range Mean ± SD Overall QOL ± ± SR WHOQOL-Bref ± ± People s with aphasia experience of completing the WHOQOL-Bref from speech and language therapists perspectives of easy of understanding and responding, assistance required, and length administration Five speech and language therapists, including the researcher, administered the testing packs of instruments across the 25 PWA and reported their subjective ratings of ease of administration in a zero to 10 visual analogue scale. The results show that speech and language therapists reported the WHOQOL-Bref easy to use with PWA of this sample. The use overall was actually very easy (1.79 ± 2.10); with some individuals almost no help was needed (0.20) but with some a medium help was needed (5.00). It took an average of 14 minutes to administer, with a minimum of seven minutes and a maximum of 20 minutes (see table 29). Table 29: Speech and language therapists experience with WHOQOL-Bref WHOQOL-Bref use n Range Mean ± SD Understanding ± 1.35 Answering ± 1.50 Help needed ± 1.54 Use overall ± 2.10 Time spent (minutes) ± Brief summary of the results of study 2: In average, PWA had a bad or neither good nor bad QOL and were neither satisfied neither dissatisfied with their SR. Their QOL and SR were worse than those of people from general population. QOL was significantly correlated to emotional status, educational level, activities (BI, FAI and CDP), and CDP participation. Participation was the best predictor of PWA s QOL. SR was significantly correlated with emotional status, activities (BI, FAI and CDP), CDP participation, and aphasia coefficient. Participation was the best predictor of PWA s SR. WHOQOL-Bref SR domain was a better predictor of overall PWA s QOL than the same domain of WHOQOL-100. Brígida Patrício 108
109 Results 4.3. Study 3 (Caregivers sample) The caregivers sample was aged 26 to 73 years, with a mean age of 51 years. The majority was female (68%), had 10 to 12 years of education (36%), was employed (64%), was married or lived with a partner (76%), lived with the partner and children (40%), was from a medium-low socioeconomic status (48%) and reported themselves as healthy (92%). All of them lived in mainland and the majority lived in Douro Litoral (52%) as shown in Table 30. Table 30: Caregivers' sociodemographic data Range Mean ± SD Age ± 15.5 n Percentage (%) Gender Male Female Educational level Illiterate years years years years University Postgraduate Occupation Employed Unemployed Retired Volunteer Student Living Place Trás-os-Montes e Alto Douro Douro Litoral Beira Litoral Alto Alentejo Algarve Marital status Alone Number of cohabitants Single Married/Partner Separated/Divorced Widow/widower Brígida Patrício 109
110 Results Table 30: Caregivers' sociodemographic data (continued) n Percentage (%) Type of cohabitants Partner Partner & Children Children Sibling(s) Parent(s) & Sibling(s) Other Socioeconomic status High Medium-high Medium Medium-low Low Health* Unhealthy Healthy * Healthy and unhealthy status was determined by people responding to the WHOQOL-Bref s question Are you currently ill? ; illness = unhealthy QOL of PWA s caregivers In average, the caregivers considered their QOL between neither good nor bad and good (mean=63) while Portuguese general population classified it as good (mean=72). The QOL domain with the lowest score was the SR, followed by the environment and psychological domain. The domain with the greatest score was the physical domain. All the domains were qualitatively classified as neither satisfied nor dissatisfied or satisfied (see Table 31). Table 31: Overall QOL and domains means for caregivers N Range Mean Std. Deviation Overall QOL Physical domain Psychological domain SR domain Environmental domain Regarding the correlations between overall QOL and QOL domains in caregivers sample, all the correlations were significant; the majority of the domains were moderately associated with overall QOL results. The domain with the greatest correlation was the environment (ρ=0.71, p=0.000) followed by the psychological domain (ρ=0.62, p=0.001). The weakest correlation was with SR Brígida Patrício 110
111 Results domain (ρ=0.47, p=0.017) (see Appendix Z, Table Z.1). These correlations were weaker than those found with PWA s sample. Overall QOL correlations of both WHOQOL-Bref (ρ=0.47; p=0.017) and WHOQOL-100 SR (ρ=0.46, p=0.024) domains were similar (see Appendix Z, Tables Z.1 and Z.2). Overall QOL was significantly and positively correlated with age (ρ=0.46, p=0.02) and negatively with emotional status (ρ=-0.53, p=0.006), but was not correlated with educational level, socioeconomic status, number of cohabitants and coping as shown in Table 32. Correlations with age and emotional status were moderate and were stronger than those observed in general population. Educational level and socioeconomic status were correlated with overall QOL in Portuguese general population and PWA, but the same was not shown for caregivers. Age was correlated with caregivers and Portuguese general population s QOL but not with PWA s QOL. Emotional status was correlated with overall QOL in the three groups. Table 32: Caregivers overall QOL correlations with age, educational level, socioeconomic status, number of people living with, emotional status and coping Correlations (Spearman's rho) Overall QOL Age Education Level Socioeconomic Status Overall QOL Correlation Coefficient * Sig. (2-tailed) N Number of cohabitants Emotional Status Correlation Coefficient Sig. (2-tailed) N 25 Correlation Coefficient ** Sig. (2-tailed) N 25 Coping Correlation Coefficient Sig. (2-tailed) N 25 *. Correlation is significant at the 0.05 level (2-tailed). **. Correlation is significant at the 0.01 level (2-tailed). Although the analysis of the coping strategies used are not part of the aims of this study, when analysing Table Z.3 of Appendix Z it is interesting to notice that the coping strategies used and recognized as really helpful were the items 12 ( taking life one day at the time ) and 25 ( believe in myself and in my ability to handle the situation ). The caregivers rarely used strategies that found Brígida Patrício 111
112 Results not to be helpful, although items 2 ( letting off steam in some way e.g. shouting, yelling or the like ) and 22 ( ignoring the problem and hope it will go away ) were reported as used. The Kruskal-Wallis test revealed no significant differences in overall QOL with caregivers gender (p=0.086), marital status (p=0.365), type of cohabitants (p=0.781), occupation (p=0.572), and health (p=0.526) (see Appendix Z, Table Z.4). These results are quite similar to those of PWA. Testing the correlation of caregivers overall QOL with PWA variables (time post-stroke, aphasia severity, activities (BI, FAI, CDP), participation and cognition, time after discharge, speech and language therapy time and the time since finishing speech and language therapy), results showed significant correlations with activities (ρ=-0.46, p=0.02) and participation (ρ=-0.56, p=0.004), as measured by CDP (see Appendix Z, Tables Z.5 and Z.6). Caregivers overall QOL was not significantly different depending on motor impairment of the PWA (p=0.224), aphasia etiology (p=0.180), and having speech and language therapy currently or having finished it (p=0.461) (see Appendix Z, Table Z.7). Using a linear regression model with all the WHOQOL-Bref domains, the psychological domain is the best predictor of caregivers overall QOL (54%) (see Appendix Z, Table Z.8). When introducing only the SR domains of both WHOQOL-Bref and WHOQOL-100 (as they are a core focus in this research) in the linear regression model, the WHOQOL-Bref SR domain was the best predictor (18%) of overall QOL (see Appendix Z, Table Z.9). The variables introduced in caregivers QOL linear regression model were selected based on significant correlations identified in the current study alone regarding caregivers and Portuguese general population s QOL (age, emotional status, activities measured by CDP, participation, educational level and socioeconomic status), as there is no existing research to consider. The results showed that participation of PWA was the best caregivers QOL predictor (predicted 31% of overall results), followed by caregivers age and emotional status. Altogether these variables explained 57% of the variance of caregivers QOL results (see Table 33). Brígida Patrício 112
113 Results Table 33: Caregivers' overall QOL predictors Linear regression (stepwise) ANOVA(d) Model R R Square df F Sig a ; ,004a b ; ,001b c ; ,000c a. Predictors: (Constant), Participation (CDP) b. Predictors: (Constant), Participation (CDP), Age c. Predictors: (Constant), Participation (CDP), Age, Emotional Status d. Dependent Variable: Overall QOL Social relationships of people s with aphasia caregivers In average, caregivers were neither satisfied nor dissatisfied with their SR (mean=59) as shown in Table 31. These results are lower than those of Portuguese general population (mean=74). The number of cohabitants (ρ=-0.40, p=0.048) was negatively correlated with the satisfaction of the caregivers with their SR revealed by WHOQOL-Bref SR domain, wherein caregivers who lived with fewer people were more satisfied with their SR. The same variable was not correlated with WHOQOL-100 SR, but the p value is very close to 0.05 (p=0.059). This also happens with the socioeconomic status variable, but inversely, concerning the SR domains. In addition, the WHOQOL- 100 SR domain correlated moderately with level of education (ρ=0.43, p=0.033), as shown in Table 34. Table 34: SR domains correlations with age, educational level, socioeconomic status, and number of people living with for caregivers group Correlations (Spearman's rho) Age Education Level Socioeconomic Status Number of cohabitants WHOQOL-Bref Correlation Coefficient * SR Sig. (2-tailed) N WHOQOL-100 Correlation Coefficient * ** SR Sig. (2-tailed) N **. Correlation is significant at the 0.01 level (2-tailed). *. Correlation is significant at the 0.05 level (2-tailed). For caregivers, the SR domains (WHOQOL-Bref and WHOQOL-100) also correlated significantly with their emotional status (Bref SR ρ=-0.48, p=0.015; 100 SR ρ=-0.55, p=0.005), and with variables of PWA: FAI activities (Bref SR ρ=0.51, p=0.009; 100 SR ρ=0.41, p=0.045), CDP activities (Bref SR ρ=- Brígida Patrício 113
114 Results Table 35: SR domains correlations with age, educational level, socioeconomic status, and number of people living with for caregivers group Correlations (Spearman s rho) WHOQOL-Bref SR WHOQOL-100 SR 0.42, p=0.038; 100 SR ρ=-0.53, p=0.007), and CDP participation (Bref SR ρ-0.56, p=0.003; 100 SR ρ=- 0.59, p=0.002). Concerning these variables, the worse the caregiver emotional status, the less satisfied with SR; and the more the PWA activities and participation, the more the caregiver satisfaction with SR. The results for both SR domains were similar for these variables. In addition, the WHOQOL-100 SR domain correlated with aphasia coefficient (ρ=0.49, p=0.014). In this case, the higher the PWA coefficient (less severity), the better the caregivers satisfaction with SR, as shown in Table 35. WHOQOL- Bref SR WHOQOL -100 SR Time poststroke Emotional Status Aphasia coefficient Correlation Coefficient ** * Sig. (2-tailed) N Correlation Coefficient 0.755** ** 0.485* Sig. (2-tailed) N Activities (BI) Correlation Coefficient Sig. (2-tailed) N Activities (FAI) Correlation Coefficient 0.514** 0.405* Activities (CDP) Participation (CDP) Sig. (2-tailed) N Correlation Coefficient * ** Sig. (2-tailed) N Correlation Coefficient ** ** Sig. (2-tailed) N Cognition Correlation Coefficient (MMSM) Sig. (2-tailed) N **. Correlation is significant at the 0.01 level (2-tailed). *. Correlation is significant at the 0.05 level (2-tailed). Time after discharge (Bref SR ρ=0.02, p=0.942; 100 SR ρ=0.01, p=0.958), the time PWA had speech and language therapy (Bref SR ρ=0.27, p=0.185; 100 SR ρ=0.29, p=0.156) and the time since PWA finished speech and language therapy (Bref SR ρ=-0.58, p=0.306; ρ=0.60, p=0.285) did not Brígida Patrício 114
115 Results correlate with caregivers SR domains (see Appendix Z, Table Z.10). Furthermore, no significant differences were found in caregivers SR satisfaction regarding gender (Bref SR p=0.86; 100 SR p=0.726), marital status (Bref SR p=0.86; p=0.833), type of cohabitants (Bref SR p=0.81; 100 SR p=0.818), occupation (Bref SR p=0.97; 100 SR p=0.652), health (Bref SR p=0.76; 100 SR p=0.652), motor impairment (Bref SR p=0.81; 100 SR p=0.654), aphasia etiology (Bref SR p=0.56; 100 SR p=0.952), or currently having or had speech and language therapy previously (Bref SR p=0.16; 100 SR p=0.633) using both SR domains (see Appendix Z, Tables Z.11). The variables used to determine the predictors of SR of the caregivers were those that correlated with their SR (number of cohabitants, emotional status, activities measured by FAI and CDP and participation) and additionally those that correlated with general population SR (age and educational level). The variable that better explained the variance of caregivers SR results was the number of cohabitants (33%), followed by participation (together explained 56%) and emotional status. Altogether, these variables explain 64% of SR WHOQOL-Bref results (see Appendix Z, Table Z. 12). The WHOQOL-Bref SR domain was a better predictor of overall QOL results in caregivers group (18%) than the same domain of the WHOQOL-100 (see Appendix Z, Table Z.9). For caregivers, the WHOQOL-Bref item with the highest correlation (ρ=0.90, p=0.000) with the SR domain was the number 22 ( How satisfied are you with the support you get from your friends? ), followed by item 20 ( How satisfied are you with your personal relationships? ) (ρ=0.87, p=0.000), and item 21 ( How satisfied are you with your sex life? ) (ρ=0.60, p=0.000). All the correlations were significant and strong (see Appendix Z, Table Z.13). Regarding WHOQOL-100 SR items, the highest correlations were observed for with items 12 ( How would you rate your sex life? ) (ρ=0.84, p=0.000), item 5 ( To what extent can you count on your friends when you need them? ) (0.83, p=0.000) and item 7 ( How satisfied are you with your sex life? ) (p=0.73, p=0.000) (see Table 36). Other items were also significant. The item with the weakest correlation (also non-significant) was item 1 ( How alone do you feel in your life? ) (ρ=- 0.28, p=0.180) (see Table 36). Brígida Patrício 115
116 Results SR WHOQOL- 100 Table 36: SR WHOQOL-100 items correlations for caregivers' group Correlations (Spearman's rho) SR WHOQOL- 100 Item 1 Item 2 Item 3 Item 4 Item 5 Correlation Coefficient ** ** 0.635** 0.830** Sig. (2-tailed) N Item 6 Correlation Coefficient 0.704** Sig. (2-tailed) N 25 Item 7 Correlation Coefficient 0.793** Sig. (2-tailed) N 25 Item 8 Correlation Coefficient 0.727** Sig. (2-tailed) N 25 Item 9 Correlation Coefficient 0.754** Sig. (2-tailed) N 25 Item 10 Correlation Coefficient 0.565** Sig. (2-tailed) N 25 Item 11 Correlation Coefficient 0.706** Sig. (2-tailed) N 25 Item 12 Correlation Coefficient 0.842** Sig. (2-tailed) N 25 **Correlation is significant at the 0.01 level (2-tailed) **Correlation is significant at the 0.05 level (2-tailed) Item 22 ( How satisfied are you with the support you get from your friends? ) explained 81% of SR domain (WHOQOL-Bref) overall results, followed by item 21 ( How satisfied are you with your sex life? ) that together explained 96% (see Appendix Z, Table Z.14). In the WHOQOL-100 SR domain, the item that better explained its results was item 5 ( To what extent can you count on your friends when you need them? ) (67%), followed by item 12 ( How would you rate your sex life? ) (together explained 85%) and item 8 ( How satisfied are you with the support you get from your family? ) (altogether explained 91%) (see Appendix Z, Table Z.15). Comparing the results of both SR domains in the three groups (Portuguese general population, PWA and caregivers), we can see that all the three facets (satisfaction with the SR with others, support they receive from others and sexual life) are important for their overall SR. All of the Brígida Patrício 116
117 Results WHOQOL-Bref items are strongly correlated and are consistent predictors of SR results in the three groups. Furthermore, in WHOQOL-100, items from the three facets appear as important in correlations or as predictors of overall WHOQOL-100 SR results. WHOQOL-100 SR domain better predicts overall QOL in general population sample, however the WHOQOL-Bref domain is the one that better explains it in PWA s and caregivers group. Using the WHOQOL-100 SR domain with PWA and with caregivers, some items that are not included in the WHOQOL-Bref were important predictors or revealed very strong correlations with WHOQOL-100 SR overall results (items 3, 5, 8, and 12) ( Are you bothered by any difficulties in your sex life? ; To what extent can you count on your friends when you need them? ; How satisfied are you with the support you get from your family? ; How would you rate your sex life? ). The most frequent one and the best predictor of SR for both samples was item 5 ( To what extent can you count on your friends when you need them? ) Overall quality of life and social relationships comparisons of caregivers, people with aphasia and Portuguese general population Similarly to what was done in study 2, to better compare caregivers and Portuguese general population regarding QOL and SR means, we used a procedure to reduce the general population sample to 50 individuals as similar as possible to caregivers regarding gender, age, and educational level. The demographic data of the caregivers and the reduced control group is shown in Table 37. The gender is equally distributed and age and educational level have similar results. No significant statistical differences were found for age (p=0.795) and educational level (p=0.847) for these samples (see Appendix Z, Tables Z.16 and Z.17). The following comparisons between caregivers and general population are undertaken with the reduced matched sample of general population (n=50). Table 37: Descriptive statistics of the control group and caregivers' group Control group (N=50) Caregivers (N=25) n % n % Gender Male Female Range Mean ± SD Range Mean ± SD Age ± ± Education Level ± ± 1.41 Brígida Patrício 117
118 Results Overall QOL was significantly different (p=0.029) between caregivers and general population, and furthermore, significant differences were noted concerning SR (p=0.011) (see Appendix Z, Table Z.18). The descriptive statistics presented in the following Table show that caregivers are less satisfied with their QOL and SR than the control group (see Table 38). Table 38: Descriptive statistics for overall QOL, and SR domain for caregivers and its control group Control group (N=50) Caregivers (N=25) Range Mean ± SD Range Mean ± SD Overall QOL ± ± SR WHOQOL-Bref ± ± The descriptive statistics for the PWA and caregivers groups are as follows in Table 39. These two groups are significantly different regarding age (p=0.542) and educational level (p=0.116) (see Appendix Z, Tables Z.19 and Z.20). Table 39: Descriptive statistics of the PWA s and caregivers' group PWA (n=25) Caregivers (n=25) n % n % Gender Male Female Range Mean ± SD Range Mean ± Age ± 14, ,36 ± 15,51 Education Level 1-7 4,68 ± 1, ,40 ± 1,41 When comparing QOL of the PWA to caregivers, we could see that their QOL was significantly different (p=0.0025). The same was not observed for SR (p=0.160) (see Appendix Z, Table Z.21). Looking at the descriptive statistics as shown in Table 40, we could see that PWA were less satisfied with their QOL than caregivers (with a mean 22 point difference in satisfaction) (see Table 40). Caregivers had higher mean SR satisfaction, but was not significantly different. Table 40: Descriptive statistics for overall QOL, and SR domain for PWA and caregivers PWA (N=25) Caregivers (N=25) Range Mean ± SD Range Mean ± SD Overall QOL ± ± SR WHOQOL-Bref ± ± Brígida Patrício 118
119 Results Brief summary of the results of study 3: In average, caregivers classify their QOL between neither good nor bad and good and their SR as neither satisfied nor dissatisfied. QOL was correlated with age, emotional status, CDP activities and CDP participation. PWA s participation was the best predictor of caregivers QOL. SR was significantly correlated with emotional status, number of cohabitants, level of education, FAI activities, CDP activities, CDP participation and aphasia coefficient. The best predictor of caregivers SR satisfaction was number of cohabitants. The WHOQOL-Bref SR domain was a better predictor of overall PWA s QOL than the same domain of WHOQOL-100. Caregivers had worse QOL and SR satisfaction than Portuguese general population, they had better QOL than PWA, and the differences between PWA and caregivers in SR were not significant. Brígida Patrício 119
120 Discussion CHAPTER 5: Discussion QOL study is a core important issue in the world, healthcare and aphasia rehabilitation, so evidence based empirically derived data is needed as foundation for understanding. While a negative effect of aphasia on QOL can be anticipated given the general aphasiology evidence base, population-based QOL instruments have not previously been used to report it on QOL and the use of them would enable comparisons with the broader population. The aim of this study was to determine the impact of aphasia in PWA s and their caregivers QOL using a population-based QOL measure. To our knowledge, this is the first empirical study of a large scale nature with Portuguese general population that includes people all over mainland and islands, the first Portuguese investigation that studies PWA s QOL and SR and the first study worldwide that studies the QOL and SR of PWA s caregivers identifying correlations and predictors for their QOL and SR. Interactions among QOL, SR and the other variables will be discussed as follows in three sections with regards to general population, to PWA or to caregivers studies. Whenever possible, the findings of this study will be compared with other WHOQOL-Bref studies and with Portuguese data. With regard to our clinical groups, comparisons will be undertaken with other PWA and PWA s caregivers studies whenever possible; when not possible comparisons will only be made with stroke studies Quality of life of general population Portuguese general population participants of this study consider their QOL as good. The current findings agree with research with normal older adults in Portugal (Canavarro et al., 2009; Serra et al., 2006) (note both studies are based on the same sample), and in adults in the United Kingdom (Bowling, 1995; Farquhar, 1995). The order of importance of the domains (physical, psychological, SR and environment; means range of 76 to 66) in the current study is in line with the findings from the Portuguese study of Serra et al. (2006), the Brazilian study of Fleck et al. (2000), the Danish study of Noerholm et al. (2004), and the multinational study of Skevington et al. (2004) (which did not include Portuguese participants). The ranges of the QOL domains of these studies were very similar (between 77 and 64), except for Fleck s et al. (2000) that had higher range scores for domains satisfaction (83-70). Portuguese domains findings were much higher than general population in Taiwan (Wang et al., 2006) but lower than life domains of Canadians (Hawthorne, Herrman, et al., 2006), so they are much more satisfied with their life domains than Portuguese Brígida Patrício 120
121 Discussion general population. The findings of Australian, Taiwan, Canadian and Norwegian adults are also different from the results of the current study wherein the domains were differently ordered in terms of highest to lowest raking domains (e.g. environment and psychological domains were the best scored domains) (Hawthorne, Herrman, et al., 2006; Kalfoss et al., 2008; Wang et al., 2006). All the sample sizes of these studies were composed of more than 315 individuals, whilst Fleck s et al. (2000) study was composed of 50 healthy participants (Fleck et al., 2000; Hawthorne, Herrman, et al., 2006; Noerholm et al., 2004; Serra et al., 2006; Skevington et al., 2004; Wang et al., 2006), so the higher scores from the Fleck et al. (2000) study should be considered with caution. Two other Brazilian studies with larger samples (n=751 and n=3574) differ from Fleck s et al. (2000) Brazilian findings (and from ours) wherein the domains mean ranges were larger (79-57) and the SR domain was the best scored (Cruz et al., 2011; Moreno et al., 2006). This suggests that Brazilians are more satisfied with their social network. In summary, people have different levels of satisfaction of QOL domains worldwide, but Portuguese population findings of this study are in line with some findings reported in the literature (Fleck et al., 2000; Noerholm et al., 2004; Skevington et al., 2004). Additionally, Portuguese population seems to be as similarly satisfied in 2006 as in 2014 when comparing the current findings with those of Serra et al. (2006). Usually, the studies of general population QOL report data on QOL domains, overall QOL, and their associations to age, gender and health. They report less frequently on emotional status, educational level, living place, marital status, occupation and type of cohabitants as was studied in the current study (Canavarro et al., 2009; Cruz et al., 2011; Fleck et al., 2006; Fleck, Leal, et al., 1999; Fleck et al., 2000; Gameiro et al., 2010; Hawthorne, Herrman, et al., 2006; L. Leung & Lee, 2005; Serra et al., 2006; Skevington et al., 2004; Spagnoli et al., 2012; Wahl et al., 2004). This may be due to the fact that many studies on general population QOL were mainly focused in studying the psychometric properties of the instruments and thus only studying associations with few sociodemographic variables. Thus only fewer studies are available for contextualisation of the current findings. QOL and age were significantly associated in this study of the Portuguese general population. Although the association was weak, younger ages were associated with better QOL. These findings are in line with those of Fleck, Louzada, et al. (1999), Hawthorne, Herrman, et al. (2006); Skevington et al. (2004) and Wahl et al. (2004), but not with those of Spagnoli et al. (2012) who reports on Portuguese general population data. This may be due to the fact that Spagnoli et al. (2012) studied individuals with a limited age range of 25 to 50 years. Brígida Patrício 121
122 Discussion Significant associations were also observed for educational level, wherein people with higher levels of education reported better QOL, and in specific domains. These findings support those of Wang et al. (2006) and Wahl et al. (2004), although this latter study used a different QOL tool (QOLS- N). Portuguese people highest QOL domains are in physical and psychological. Other Portuguese research has also found a positive association and highest satisfaction for psychological QOL albeit on a different measure (WHOQOL-100) (Gameiro et al., 2010). Conversely, participants in Gameiro s et al. (2010) study were least satisfied with their physical domain, whereas participants in the current study were most satisfied. This difference could be explained by the use of a different measure or different sampling. Finally, whilst Portuguese most educated participants were most satisfied with their physical domain, Brazilians were most satisfied with their SR (Cruz et al., 2011), and this may be attributed to different culture and value systems despite the same language (two varieties: European Portuguese and Brazilian Portuguese). Emotional status and QOL were also significantly related. The most relevant literature was consulted for comparisons and derive from Portugal, Brazil and Hong Kong; many other studies did not investigate this variable in general population sample (Fleck et al., 2000; K. F. Leung, Wong, Tay, Chu, & Ng, 2005; Serra et al., 2006). Current findings agree with Fleck et al. (2006), L. Leung and Lee (2005), and Serra et al. (2006), wherein people with better emotional status reported better QOL. Socioeconomic status was also significantly associated with overall QOL, wherein people with higher socioeconomic levels reported higher QOL scores. This same finding was observed in the southern Brazilian general population (Cruz et al., 2011). In the current study, islanders reported higher QOL than people living on the mainland. A similar pattern has been identified in an English relevant study wherein London rural citizens reported better QOL than city centre (Farquhar, 1995). Knowing that the largest Portugal cities are in the mainland, this agrees with the previously established findings even though Farquhar (1995) used a qualitative approach. Whilst Gameiro s et al. (2010) study makes claims regarding residential location, its data is on life domains and not overall QOL, so the reports within the paper do not enable comparisons to the current findings. Overall QOL was also significantly different between marital status subgroups. In our study, single people had better QOL. This does not agree with Wahl et al. (2004), whose findings showed that being married or living with a partner is associated to a better QOL (Wahl et al., 2004). Our data may be influenced by the fact that the majority of the single sample was young (as in Wahl et al. s (2004) study), and younger people had better QOL. Regarding QOL domains, Gameiro et al. (2010) observed that divorced/separated and widower people had worse results and found no Brígida Patrício 122
123 Discussion differences between single and married people, but these results are not for overall QOL whereas this was the focus of the current study. Regarding different types of cohabitants, the differences were significant and those who live with the parents had the best QOL. No literature was found to compare this data with. Again, this data could be influenced by age because the great majority of the sample (82%) that lived with parents was 25 to 34 years. Quality of life among employed, unemployed and retired people was also significantly different. Employed people had the best QOL and retired the worse. This data supports results previously published by Wahl et al. (2004), but may be also influenced by age since retired people are older. In this study there seems to be some interdependence of age (being young), marital status (being single), residential arrangement (living with parents), and occupation (being employed). This requires further investigation in future studies. Regarding health status, significant differences were also found among the unhealthy and healthy groups, with the former reporting better QOL. This is in agreement with Fleck, Louzada, et al. (1999), Wahl et al. (2004), Hawthorne, Herrman, et al. (2006), Fleck et al. (2006), and Canavarro et al. (2009) findings. In the current study, gender and cohabitant number had no association with QOL. The gender findings are similar to those from Molzahn et al. (2010), Brajša-Žganec et al. (2011), and Spagnoli et al. (2012), but not with those of Wahl s et al. (2004) wherein women had higher QOL than men. All domains scores from male and female participants of the present study were higher than those shown by Gameiro et al. (2010) in Portugal (when comparing the same domains of WHOQOL-100), and by Cruz et al. (2011) in Brazil. Men in the current study reported higher QOL psychological satisfaction, whereas physical QOL was the best for women, and the worst domain was environment for both. Interestingly, the Portuguese study by Gameiro et al. (2010) identified the level of independence, followed by SR domain as the ones with the highest scores both for men and women, and environment as the lowest scored for men. Skevington s (2004) multi-centre study reported higher means for men s physical domains, and social for women s domains, and lower scores for environment (Skevington et al., 2004). Environment was consistently indicated as the area of life of least satisfaction in Portuguese studies, and in the multinational study of Skevington et al. (2004) (in which Portugal was not represented), but there are some differences regarding the domains that people are more satisfied. The satisfaction with life domains may change over time and can be culturally influenced justifying the differences with Skevington s et al. (2004) findings. No data is available in literature about number of cohabitants and its interactions with QOL. Brígida Patrício 123
124 Discussion Additionally, this study showed that emotional status and educational level were the sociodemographics that best predicted QOL and that physical and psychological domains were the domains that better predicted QOL. Very rarely have studies identified QOL predictors, however Gameiro et al. (2010) identified that educational level was a good predictor of some QOL domains. Serra et al. (2006), did not identify predictors but showed that the physical and psychological domains had the strongest correlation with overall QOL (Serra et al., 2006). The weakest correlation was with the SR domain (Fleck et al., 2000; Serra et al., 2006). The same results were found in our study Social relationships of general population The participants of the current study were satisfied with their SR, which aligns with existing Portuguese findings (Gameiro et al., 2010; Serra et al., 2006). The multicentre findings of Skevington et al. (2004), as well as Brazilian, Canadian, Norwegian, and Danish findings also corroborate the current findings (Cruz et al., 2011; Fleck et al., 2000; Hawthorne, Herrman, et al., 2006; Kalfoss et al., 2008; Moreno et al., 2006; Noerholm et al., 2004; Skevington et al., 2004); and all findings suggest that Taiwanese people are the least satisfied with their SR (neither satisfied neither dissatisfied) and all their QOL domains (Wang et al., 2006). Regarding SR, in the present study, they were influenced by age, educational level and emotional status. People with younger ages, more years of education and better emotional status were more satisfied with their SR; and age and emotional status were its best predictors. No association with SR was found regarding socioeconomic status and number of cohabitants. WHOQOL tools SR interactions with sociodemographics are not fully investigated in literature, although Gameiro et al. (2010) found the same association for age, educational level, and socioeconomic status. This agrees with other relevant literature findings (Cruz et al., 2011; Noerholm et al., 2004; Skevington et al., 2004). No data was found in literature regarding number of cohabitants. In the current study, the WHOQOL-100 better predicted Portuguese general population SR than the same domain of WHOQOL-Bref, and items 10 (ability to provide for or support others), 7 (sex life), 5 (count on friends), 11 (relationship with family) and 1 (loneliness) were the best predictors of SR overall results. From all these items, the 7 (sex life) is the only one that is included within the WHOQOL-Bref. No literature was found regarding these data, making any contextualisation of this finding difficult. Overall, it seems that the longer subscale is more informative and thus, when using Brígida Patrício 124
125 Discussion the Bref subscale it may be missing the opportunity to tap into other areas (as found in the WHOQOL-100 SR domain) such as supporting others, relationship with friends and family, and loneliness. Moreover, the findings of this study showed that the SR of the WHOQOL-Bref was the domain with the weakest association to general population overall QOL results, which is in line with the literature and the only three items of this domain may contribute for this result (Hawthorne, Herrman, et al., 2006; Skevington et al., 2004; Wang et al., 2006) 5.3. Quality of life of people with aphasia Our PWA s sample, classified their QOL between bad and nor good nor bad and the results showed that their QOL was significantly worse compared to Portuguese general population, and caregivers. A decreased QOL has been previously reported for people with aphasia (Bose et al., 2009; Hinckley, 1998; A. Manders et al., 2010; Ribeiro, 2008; Ross & Wertz, 2002, 2003) and with stroke (Astrom et al., 1992; Clarke et al., 2002; Haley et al., 2010; Jaracz & kozubsky, 2003; Jonsson et al., 2005; Niemi et al., 1988; Tobin, Hevey, Horgan, Coen, & Cunningham, 2008) but only the studies of Ross and Wertz (2002, 2003) used the same instrument of the current study with PWA. Moreover, participants of Ross and Wertz (2002, 2003) study are more satisfied with life (mean=72) than the sample of the current study (mean=41). The QOL of their non-brain injured sample is also much higher (mean=84) than QOL of Portuguese general population (mean=72) (Ross & Wertz, 2002). In the present study individuals with aphasia had lower levels of satisfaction in all QOL domains than Portuguese general population; and furthermore, the order of life domains was different, where the life domain best scored by PWA was environment, and SR the worst. Comparing with general population, lower results for PWA s QOL and life domains were reported in literature (A. Manders et al., 2010; Ribeiro, 2008; Ross & Wertz, 2002, 2003). Domains comparison with Ross and Wertz s (2002, 2003) study is not possible as they did not report domains findings. Overall, studies with PWA identified many changes in communication, and SR (Bose et al., 2009; Cruice, Hill, et al., 2010; Zemva, 1999), which may explain the lower scores of SR for our sample. In line with PWA s results of the present study, for people with stroke, S. Levasseur et al. (2005) found that relationships with family and friends is the most important domain, which ought to be taken into account when it is the less satisfied domain for PWA. SR will be further explored in the coming paragraphs. For our sample of Portuguese general population the order of domains satisfaction were slightly different (more satisfaction with the physical domain, followed by psychological, SR Brígida Patrício 125
126 Discussion and environmental domains), which means that aphasia may change the way people are satisfied with their life areas, especially regarding SR, environment and physical domains. PWA are less satisfied with environment than general population, nevertheless environment turned to be the best scored domain by PWA when compared with the other QOL domains. Stroke consequences such as hemiparesis and aphasia and the resulting emotional changes may be the rationale for environment becoming the best scored and for the lower satisfaction with SR, physical and psychological domains. For PWA, their emotional health, level of education, and involvement in activities and participation associates with their QOL. Better emotional status, higher levels of education, higher involvement in activities and participation were associated to higher levels of QOL; and participation and emotional status were the best QOL predictors. Emotional status (depression, and mental health) was identified as a great predictor or as influencing QOL by several studies with PWA (Cruice, Worrall, et al., 2010; Cruice et al., 2003; Hilari, Wiggins, et al., 2003) and people with stroke (Astrom et al., 1992; Clarke et al., 2002; Haley et al., 2010; Jaracz & kozubsky, 2003; Jonsson et al., 2005; Kim et al., 1999; King, 1996; Kong & Yang, 2006; Kranciukaite & Rastenyte, 2006; Mota & Nicolato, 2008; Niemi et al., 1988; Oliveira & Orsini, 2008), wherein people with better emotional status had higher levels of QOL. This seems to be a strong consistent finding. However, Martins (2006) did not find this correlation for Portuguese people with stroke, which can most likely be attributed to a different QOL (SIS) and different sample characteristics. Regarding educational level and QOL, Manders (2010) results for PWA seem to support our findings, but there is evidence to the contrary from Engell s et al. (2003), and Ribeiro s (2008) results for the same population, and for Kim s et al. (1999) results for people with stroke (Engell et al., 2003; Kim et al., 1999; Ribeiro, 2008). Several methodological aspects may explain these findings: different instruments (ALQI and SAQOL-39), different distribution and representativeness in education levels (Engell et al. (2003) analysed two levels of education, Ribeiro (2008) analysed three and our study analysed seven different levels of education), and cultural differences may justify this different influence of educational level in QOL, as Engell et al. (2003) is German, Ribeiro (2008) is Brazilian, and Kim et al. (1999) is Canadian. One of the QOL predictors (emotional status) was the same for PWA and Portuguese general population in the current study. These findings suggest that the presence of aphasia did not interfere with some core predictors of Portuguese citizens QOL. QOL, activities and social participation associations were also shown in the current study; the less the engagement in activities and social participation, the worse was QOL. Regarding PWA, the studies report the loss of autonomy for many activities (Ross & Wertz, 2002; Zemva, 1999), Brígida Patrício 126
127 Discussion including socialisation (Bose et al., 2009; Sarno, 1997), leading to less satisfaction with QOL (Hilari, Wiggins, et al., 2003). Independence, socialising and engaging in activities have major importance for those with aphasia to have a successful living (K. Brown, Worrall, Davidson, & Howe, 2010; Cruice et al., 2006). The activities are a core aspect that influence QOL (Cruice, Hill, et al., 2010). Current study s results are in line with these studies. According to stroke studies, socialisation, returning to work and participation in activities (daily living activities and/or leisure activities) decreases after stroke (Astrom et al., 1992; Clarke et al., 2002; Kim et al., 1999; Kranciukaite & Rastenyte, 2006; Labi, Phillips, & Greshman, 1980; Martins, 2006; Niemi et al., 1988; Oliveira & Orsini, 2008; Tobin et al., 2008), so their QOL might be affected. People with stroke with lower wellbeing are less satisfied with their activities of daily living (Clarke et al., 2002), and people with better QOL have higher levels of participation in activities (Mayo et al., 2002; Oliveira & Orsini, 2008; Patel et al., 2006). This last statement is also true for Portuguese aphasia participants. Furthermore, involvement in activities and participation association to QOL was observed in general population studies (Brajša-Žganec et al., 2011; M. Levasseur et al., 2008) where indicators of activity and participation were included in test batteries. Sociodemographics such as age, gender, socioeconomic status, marital status, number and type of cohabitants, occupation and health did not significantly influence PWA QOL in our study. Age findings are in accordance with Hinckley (1998) for PWA, but not with Hilari, Wiggins, et al. (2003) and Ribeiro (2008), where the differences may be due to the use of different measures. Concerning people with stroke, most studies report no association with age (Astrom et al., 1992; Jonsson et al., 2005; Kong & Yang, 2006; Martins, 2006), however one study with much older participants did note a significant finding (Kim et al., 1999). According to the current study findings, gender is not associated with PWA s QOL (Engell et al., 2003; Hilari, Wiggins, et al., 2003; Ribeiro, 2008), or to people s QOL after stroke (Haan et al., 1995; Kim et al., 1999; Kong & Yang, 2006; Martins, 2006). The same had been previously observed for socioeconomic status, marital status, occupation and health of PWA by Hilari, Wiggins, et al. (2003) and Hinckley (1998). Other studies that have substantially older participants or different samples are not in line with the results of the present study regarding marital status (Kim et al., 1999) and gender (Jonsson et al., 2005). With regard to cohabitants, Astrom et al. (1992) reported that living alone is associated to QOL in people with stroke. However we did not find this association to be significant, PWA living with few cohabitants have higher levels of QOL, which is in line with Astrom s et al. (1992) findings. Cognition, motor impairment, time post-stroke, aphasia aetiology, aphasia severity (language functioning), the time PWA were discharged from hospital, and the aspects related to speech and Brígida Patrício 127
128 Discussion language therapy (how long; time since finished, and currently having or having had speech and language therapy) did not influence the QOL of PWA in the current study. These findings agree with the literature regarding PWA s motor impairment (Hinckley, 1998), aphasia severity (Engell et al., 2003; Hinckley, 1998; Ross & Wertz, 2002) and time post stroke (Engell et al., 2003; Ribeiro, 2008). Hilari, Wiggins, et al. (2003) reported the influence of comorbidities in QOL, considering more than motor impairment, so comorbidities beyond motor impairment seem to influence the QOL of PWA (Hilari, Wiggins, et al., 2003), but motor impairment per se do not (Hinckley, 1998). Cognition is also a predictor of QOL according to Hilari, Wiggins, et al. (2003). The instrument used to collect this data (Raven Coloured Progressive Matrices), and the QOL instrument (SAQOL-39) may be the reasons for different findings (Hilari, Wiggins, et al., 2003). Regarding time post stroke Hinckley (1998) did not support our findings perhaps because the sample had much more time post stroke (mean=46 months). The time PWA were discharged from hospital, and the aspects related to speech and language therapy have not been previously reported in the literature. Concerning people with stroke, according to the current study findings, stroke type (Kim et al., 1999; Martins, 2006), and time post stroke (Kong & Yang, 2006) is not associated to QOL. Age and socioeconomic status were associated both with PWA QOL and with Portuguese general population QOL. Additionally, marital status do not influence PWA s QOL as it seems to for Portuguese general population, as well as the type of cohabitants, occupation and general health. These findings may suggest that in the presence of aphasia other variables such as participation have more importance for QOL than age. However, we should acknowledge that these findings can be influenced by sample characteristics and size, for example, living place (mainland or islands) cannot be considered for our PWA because all the participants with aphasia lived in mainland Social relationships of people with aphasia Participants with aphasia are less satisfied with SR than Portuguese general population and their caregivers. In fact, the social contacts tend to diminish after a stroke (Astrom et al., 1992; Martins, 2006) or aphasia for PWA (Bose et al., 2009; Zemva, 1999) and their caregivers (Zemva, 1999), but they are a great contributor for successful living (K. Brown et al., 2010; Cruice et al., 2006). Emotional status, activities and participation influence significantly the SR satisfaction of PWA and its greatest predictor is participation. This kind of data was not previously available in the Brígida Patrício 128
129 Discussion literature, although, as emotional status, activities and participation seem to be important SR predictors, they should be assessed and addressed in interventions in order provide better levels of SR in these subjects. There is no data available in the literature to compare the following findings, so these findings are discussed on their own merit. The findings of our study suggest that the Bref WHOQOL SR domain is more appropriate to assess PWA s QOL than its longer version from WHOQOL-100. These findings reveal that WHOQOL-Bref has good coherence and breadth for this clinical group, so that there is no need for additional questions. In fact, this domain showed a stronger association to overall QOL than the association observed for general population. WHOQOL-Bref is actually very easy to use with PWA with the characteristics of our sample and takes a very reasonable time to administer. These characteristics are indeed good usability indicators (Cruice, Hirsch, et al., 2000). In clinical practice, this instrument may assist clinicians in making judgments about the life areas most affected by disability and, according to this, making treatment decisions. Additionally, by facilitating the understanding of the impact of the disability in the clients lives the interaction between health professional and client may improve, be more comprehensive and the client may find his treatment more meaningful (WHO, 1996; WHOQOLGroup, 1993). To know more details about a client s life and their SR, an interview should be used Quality of life of the caregivers This is the first study that studied PWA s caregivers QOL and reported their QOL between neither good nor bad and good. Their QOL is significantly different (worse) than that of Portuguese general population, and better than that of PWA. In fact, there are great negative changes in caregivers of PWA s lives (Bakas et al., 2006; Cruice, 2007; Franzén-Dahlin et al., 2008; Grawburg et al., 2013a; Michallet et al., 2003; Nätterlund, 2010; Santos et al., 1999), but no studies with PWA s caregivers have data about their level of satisfaction with life. Great negative changes are also observed in caregivers of people with stroke (C. Anderson et al., 1995; Bethoux et al., 1996; Blake & Lincoln, 2000; Blonder et al., 2007; Bugge et al., 1999; Exel et al., 2005; Jeng-Ru et al., 1998; Jonsson et al., 2005; Morimoto et al., 2003; Rombough et al., 2006; Scholte op Reimer et al., 1998; Tang & Chen, 2002), so aphasia and stroke seem to have a consistent negative influence on life satisfaction of the caregivers. There are no published reports on caregivers QOL domains or predictors in aphasia so the findings are discussed on their own merit and analysed comparing to related findings available in Brígida Patrício 129
130 Discussion literature. The findings of this study showed that the life domain with the greatest association with caregivers QOL is the environment followed by psychological. The weakest association was with the SR domain. Having only three items of SR domain may contribute for this result regarding this domain (Hawthorne, Herrman, et al., 2006; Skevington et al., 2004; Wang et al., 2006). Moreover, SR is the domain where caregivers are less satisfied (SR will be further explored below). The best QOL domain predictor of PWA s caregivers QOL is the psychological domain. Emotional status is actually strongly associated to PWA s caregivers QOL, being its strongest predictor. Many caregivers of PWA report changes on their emotional status (Hemsley & Code, 1996; Howe et al., 2012; Kitzmuller et al., 2012; McGurk et al., 2011; Michallet et al., 2003; Nätterlund, 2010; Pound et al., 2001; Santos et al., 1999) so their QOL is strongly and negatively influenced by their emotional state. Knowing that emotional status is significantly associated with QOL, it is necessary to take into account and address it in order to improve caregivers QOL. Many caregivers of PWA also report burden, need for support and respite (K. Brown et al., 2011; Denman, 1998; Kitzmuller et al., 2012; Michallet et al., 2003; Nätterlund, 2010; Pound et al., 2001), which might indicate that environment is not adequate for these people s support needs, and it might be also crucial for their QOL given the strong association with the environmental domain to QOL. Another important finding is that age of the caregiver and activities and participation of the PWA also influence significantly caregivers QOL, so that working on PWA s activities and social participation may have a positive impact in caregivers life satisfaction. Age is also a strong predictor of caregivers QOL. Older caregivers had better QOL, which may have to do with their experience to cope with life challenges. The coping strategies most used by the caregivers were problem- and emotion-focused, e.g. problem solving, control of the significance of the problem, acceptance and reframing (McGurk et al., 2011; Michallet et al., 2003). Older caregivers may use these strategies more effectively and might be an important resource to help the younger caregivers Social relationships of the caregivers Caregivers were less satisfied with SR than Portuguese general population, and more satisfied than PWA although the difference is not statistically significant. Another novel finding is that caregivers SR are significantly influenced by socioeconomic status, number of cohabitants, emotional status of the caregiver, and activities and social participation of PWA. Number of cohabitants and emotional status were the best predictors of their SR. These findings suggest that caregivers living with fewer people are more satisfied with SR. It may be that living with fewer Brígida Patrício 130
131 Discussion people may improve the quality of the interactions. The literature did not treat the data this way so it is not possible to make comparisons, but many changes in SR have been previously reported (Hemsley & Code, 1996; Kitzmuller et al., 2012; Le Dorze et al., 1996; Le Dorze et al., 2009; Michallet et al., 2003; Nätterlund, 2010; Pound et al., 2001; S. Williams, 1993). Comparing with the other samples of our study, emotional status seems to have great importance for SR, since it is strongly associated or predictive of the SR satisfaction of the three groups. Additionally, activities and participation of PWA seem to be crucial for both PWA s and caregivers SR satisfaction. So these are important aspects to address and improve in order to promote the SR of both. Overall, results show that aphasia and its language and communication consequences seem to impact negatively in PWA and caregivers QOL and SR satisfaction, since the satisfaction with their QOL and SR are much lower than Portuguese general population and depends on important variables linked to aphasia consequences such as communicative activities and social participation of the person with aphasia. Emotional status, activities and social participation seem to be core variables to improve both PWA and caregivers QOL and SR. Brígida Patrício 131
132 Study limitations, future work and conclusions CHAPTER 6: Study limitations, future work and conclusions 6.1. Study limitations and future work As limitations of the current study, the response rate (58%) of our Portuguese general population sample is an issue since we don t know the reasons for non-responding and whether the QOL of non-responders is similar to the responders. The non-probability sampling method used is also a limitation, so the findings should be interpreted with caution. Nevertheless, individuals within this study are a reasonably close match to the Portuguese population characteristics for mean age and gender, and the effect sizes were small (correlation and regression) and medium (chi-square). More studies are needed in order to achieve reference values for this population allowing comparisons among other healthy or unhealthy populations. In order to achieve that, a representative and larger sample is desirable. The size of PWA s and caregivers samples is also an issue, as well as the fact that only PWA with good auditory comprehension were included. It is very challenging to measure outcomes for a representative group of PWA since not all persons can be recruited given the instruments used. This is an identified issue for PWA but also for people with stroke without aphasia (Mayo et al., 2002). Although we used an adequate sample size when comparing to other studies with PWA (Bose et al., 2009; Cruice, Hill, et al., 2010; Engell et al., 2003; Lata-Caneda et al., 2009; Ross & Wertz, 2003; Zemva, 1999) it is still not enough the make generalisations and to use statistics with more power. Therefore the results from PWA s and caregivers studies should be interpreted with caution too. A bigger and representative sample is desirable for future research. Additionally, more work should be done concerning QOL measures that are suitable for people with severe aphasia. It can be extremely difficult to facilitate the understanding and expression of people with severe aphasia, although all the efforts should be undertaken to make it possible, since they are frequently excluded from the studies and the communication impact on their lives should also be studied. Another study limitation is that the data collection was undertaken by different speech and language therapists because it may introduce some variations in administrating the instruments. However training before the data collection reduced this confounding factor. This method allowed more PWA and caregivers to participate all across the country and allowed an overall assessment about the usefulness of the WHOQOL-Bref by different speech and language therapists. In future research speech and language therapists may be asked to video record while administering new measures (such as CDP and WHOQOL-Bref) for the researcher to check on fidelity of new assessment administration. Brígida Patrício 132
133 Study limitations, future work and conclusions The low reported QOL and SR, and emphasis in activities and participation of the PWA suggest that professionals should consider them when offering an intervention to PWA and caregivers. Activities and participation based rehabilitation programs and their impact on QOL and SR satisfaction can be the focus for future research. More research is needed in this field. As we have seen, there are many studies with people with stroke, but the knowledge about the impact of the health condition in PWA s QOL is much more limited. The same was observed for PWA s caregivers. Different methodologies and instruments used in the studies difficult the comparison among all of them. Thus, common instruments methodology and variables studied are desirable to facilitate comparisons and generalisations as advocated by COMET initiative and recent published papers regarding the importance of core outcome measurements in aphasia (Brady et al., 2014; Hula, Fergadiotis, & Doyle, 2014; MacWhinney, 2014; Wallace, Worrall, Rose, & Le Dorze, 2014). WHOQOL-Bref seems to be an adequate tool to use with PWA moderately impaired, as well as the CDP that is a more comprehensive tool. More comprehensive and inclusive QOL assessment tools should be developed or adapted and used in intervention and research with PWA. Studies regarding the efficacy of treatments are also needed and QOL assessment may be very useful as an outcome measure. Social interventions, family centred and community-based programs (focused on activities, participation and QOL) with PWA and their caregivers should be undertaken in order to enhance their SR and QOL satisfaction Conclusions In the current study PWA and their caregivers are less satisfied with their QOL and SR than Portuguese general population, so aphasia seems to impact negatively in their QOL and SR satisfaction. Different variables have different impacts in peoples lives concerning the three groups studied. Emotional status has great importance among the three groups concerning QOL and SR. Additionally, activities and participation of PWA have great impact in both PWA and caregivers QOL and SR. Other variables (e.g., age, educational level, and socioeconomic status) revealed their influence in these two variables (QOL and SR) though they vary according to the group and the analysed variable. Emotional status, age and educational level are the best predictors of Portuguese general population s QOL. Emotional status and participation are the best predictors for PWA s QOL. Emotional status (of the caregiver), and activities and participation (of the PWA) are the best predictors for caregivers QOL. Concerning SR, again, emotional status and age are the best Brígida Patrício 133
134 Study limitations, future work and conclusions predictors for Portuguese general population; participation is the best SR satisfaction predictor for PWA; and emotional status and the number of cohabitants for the caregivers. These results are important to take into account to focus the assessment and the intervention in the important aspects of people s lives. Rehabilitation should focus on identifying those factors that foster or impede PWA participation in activities, as well as psychological assessment and counselling in order to provide adequate services to both (PWA and caregivers) and have greater impact in their SR and QOL. Emotional status is a very important area to fulfil to help people having a better QOL, so clinicians should be vigilant and refer PWA to appropriate professionals whenever needed. Furthermore, clinicians should be very attentive to the level of activities and social participation of the PWA. They need to be assessed through measures such as the CDP and activities and participation related goals need to be integrated in rehabilitation in order to improve them and to promote PWA s and their caregivers satisfaction with life and with SR. Impairment-based assessment and therapy should not be abandoned, but expansion of traditional practices ought to be encouraged to incorporate communication and social goals according to activities and participation needs, thus enhancing patients QOL. The perspective of patients own satisfaction with activities and participation is crucial, as well as the impact of them in their QOL and SR. WHOQOL- Bref captures individuals own perception on their satisfaction with life so it is appropriate to be used by therapists in life assessment and therapy planning in aphasia. The use of the most satisfied areas of life to support and improve activities and participation of the PWA can be strategic and impactful in PWA s and their caregivers QOL and SR, as well as using activities and participation to work on the improvement of the areas of life less satisfied. PWA and caregivers should be involved and conscious of the aims and intervention planning so they can be more focused, motivated and collaborative in the rehabilitation program. The use of self-reported and life meaningful measures may facilitate this process. QOL assessment is also important to negotiate intervention methods and priorities with the team as the institutions want to provide services with the greatest positive impact possible in people lives with fewer resources. Speech and language therapy services are becoming less available since the financial resources are limited. PWA have less often the opportunity to take advantage of the SLT for the period of time they really need and in the places that are more appropriate to improve activities and participation. Moreover, people such as caregivers often do not come to hospitals. Therefore policies that outline the practices of speech and language therapy need to change if we want to address PWA and their caregivers QOL. Community based interventions may be crucial for that. When health services are not prepared to offer these services, it is recommended to do whatever is needed to enhance the goal of facilitating Brígida Patrício 134
135 Study limitations, future work and conclusions PWA and their caregivers to have quality in their lives (Cruice et al., 2006). Each case is unique so the assessment and the intervention should be adequate and individualised. Knowing the variables that are more important for their lives is needed. This will obviously have greater chance of success when the whole rehabilitation team perceives their clients QOL (Cruice, Hill, et al., 2010). Furthermore, QOL assessment is crucial in the definition, implementation and planning of health policies and to analyse the effects of policy changes, so the use of instruments such as the WHOQOL-Bref is recommended. Since it is population based cross-culturally developed instrument, clinicians, administrators and legislators can be confident on the sensitivity of the instrument and the results can be compared intra and inter individuals as well as across cultures and populations allowing a more comprehensive understanding of aphasia worldwide. Results of studies like this may contribute to converging opinions and practices. Brígida Patrício 135
136 References REFERENCES ACS, A. C. d. S. (2009). Indicadores de actividades (C. N. D. Cardiovasculares, Trans.) (pp. 1-36). Portugal: Coordenação Nacional para as Doenças Cardiovasculares. Anderson, C., Linto, J., & Stewart-Wyne, E. (1995). A population-based assessment of the impact and burden of caregiving for long-term stroke survivors. Stroke, 26(5), Anderson, K., & Burckhardt, C. (1999). Conceptualization and measurement of quality of life as an outcome variable for health care intervention and research. Journal od Advanced Nursing, 29(2), Ardila, A. (2006). Las Afasias. Miami: Department of Communication Sciences and Disorders, Florida International University. Arnold, R., Ranchor, A. V., Sanderman, R., Kempen, G. I., Ormel, J., & Suurmeijer, T. P. (2004). The relative contribution of domains of quality of life to overall quality of life for different chronic diseases. Quality of Life Research, 13(5), doi: /B:QURE f2 Astrom, M., Asplund, K., & Astrom, T. (1992). Psychosocial function and life satisfaction after stroke. Stroke, 23(4), Avent, J., Glista, S., Wallace, S., Jackson, J., Nishioka, J., & Yip, W. (2005). Family information needs about aphasia. Aphasiology, 19(3-5), doi: / Bakas, T., Kroenke, K., Plue, L. D., Perkins, S. M., & Williams, L. S. (2006). Outcomes among family caregivers of aphasic versus nonaphasic stroke survivors. Rehabilitation Nursing, 31(1), doi: /j tb00008.x Barbosa, A., Figueiredo, D., Sousa, L., & Demaind, S. (2011). Coping with the caregiving role: Differences between primary and secondary caregivers of dependent elderly people. Aging & Mental Health, 15(4), Beaton, D., Bombardier, C., Guillemin, F., & Ferraz, M. B. (1998). Recommendations for the Cross- Cultural Adaptation of Health Status Measures. USA: American Academy of Orthopaedic Surgeons, Institute for Work & Health. Berthier, M. (2005). Post-stroke aphasia: Epidemiology, pathophysiology and treatment. Drugs & Aging, 22(2), Bethoux, F., Calmels, P., Gautheron, V., & Minaire, P. (1996). Quality of life of the spouses of stroke patients: a preliminary study. International Journal of Rehabilitation Reseach, 19(4), Blake, H., & Lincoln, N. B. (2000). Factors associated with strain in co-resistent spouses of patients following stroke. Clinical Rehabilitation, 14, Blonder, L. X., Langer, S. L., Pettigrew, L. C., & Garrity, T. F. (2007). The effects of stroke disability on spousal caregivers. NeuroRehabilitation, 22(2), Bluvol, A., & Ford-Gilboe, M. (2004). Hope, health work and quality of life in families of stroke survivors. [Article]. Journal of Advanced Nursing, 48(4), doi: /j x Bose, A., McHugh, T., Schollenberger, H., & Buchanan, L. (2009). Measuring quality of life in aphasia: Results from two scales. Aphasiology, 23(7), Bowling, A. (1995). What things are important in people's lives? A survey of the public's judgements to inform scales of health related quality of life. Social Science & Medicine, 41(10), doi: Doi: / (95)00113-l Bowling, A. (2001). Measuring disease: A review of disease-specifil quality of life measurement scales (2 ed.). Buckingham: Open University Press. Brady, M. C., Ali, M., Fyndanis, C., Kambanaros, M., Grohmann, K. K., Laska, A.-C.,... Varlokosta, S. (2014). Time for a step change? Improving the efficiency, relevance, reliability, validity Brígida Patrício 136
137 References and transparency of aphasia rehabilitation research through core outcome measures, a common data set and improved reporting criteria. Aphasiology, 28(11), doi: / Brajša-Žganec, A., Merkaš, M., & Šverko, I. (2011). Quality of life and leisure activities: How do leisure activities contribute to subjective well-being? Social Indicators Research, 102(1), doi: /s Brito, L. (2002). A saúde mental dos prestadores de cuidadores a familiares idosos. Coimbra: Quarteto. Brown, K., Worrall, L., Davidson, B., & Howe, T. (2010). Snapshots of success: An insider perspective on living successfully with aphasia. Aphasiology, 24(10), doi: / Brown, K., Worrall, L., Davidson, B., & Howe, T. (2011). Living successfully with aphasia: Family members share their views. Topics in Stroke Rehabilitation, 18(5), doi: /tsr Brown, K., Worrall, L., Davidson, B., & Howe, T. (2012). Living successfully with aphasia: a qualitative meta-analysis of the perspectives of individuals with aphasia, family members, and speech-language pathologists. International Journal of Speech-Language Pathology, 14(2), Brown, R. I., Schalock, R. L., & Brown, I. (2009). Quality of life: Its application to persons with intellectual disabilities and their families - Introduction and overview. Journal of Policy and Practice in Intellectual Disabilities, 6(1), 2-6. Brundage, M., Blazeby, J., Revicki, D., Bass, B., de Vet, H., Duffy, H.,... Calvert, M. (2012). Patientreported outcomes in randomized clinical trials: development of ISOQOL reporting standards. Quality of Life Research, doi: /s Buck, D., Jacoby, A., Massey, A., & Ford, G. (2000). Evaluation of measures used to assess quality of life after stroke. Stroke, 31( ). Bugge, C., Alexander, H., & Hagen, S. (1999). Stroke patients' informal caregivers: Patient, caregivers, and service factors that affect caregiver strain. Stroke, 30(8), Cabral, M. V. (1995a). Equidade social, "estado-providência" e sistema fiscal: Atitudes e percepções da população portuguesa ( ). Sociologia - Problemas e Práticas, 17, Cabral, M. V. (1995b). Grupos de simpatia partidária em Portugal: Perfil sociográfico e atitudes sociais. Análise Social, 30(130), Canavarro, M. C., Serra, A. V., Simões, M. R., Rijo, D., Pereira, M., Gameiro, S.,... Paredes, T. (2009). Development and psychometric properties of the World Health Organization Quality of Life assessment instrument (WHOQOL-100) in Portugal. International Journal of Behaviour Medicine, 16, Cantril, H. (1963). A study of aspirations. Scientifis American, 208(2), Castro-Caldas, A. (1979). Diagnóstico e evolução das afasias de causa vascular. PhD, Faculdade de Medicina de Lisboa, Lisbon. Celia, D., & Bonini, A. (1995). Measuring quality of life: 1995 update. Oncology, 9(suppl), Chen, W.-C., Wang, J.-D., Hwang, J.-S., Chen, C.-C., Wu, C.-H., & Yao, G. (2009). Can the web-form WHOQOL-BREF be an alternative to the paper-form? Social Indicators Research, 94(1), doi: /s z Choi-Kwon, S., Kim, H.-S., Kwon, S. U., & Kim, J. S. (2005). Factors affecting the burden on caregivers of stroke survivors in south Korea. Archives of Physical Medicine and Rehabilitation, 86(5), doi: Christensen, J., & Anderson, J. (1989). Spouse adjustment to stroke: Aphasic versus non-aphasic partners. Journal of Communication Disorders, 22(4), Brígida Patrício 137
138 References Chue, W. L. (2008). The reliability of the Communication Disability Profile (CDP). Honours Degree, LaTrobe University, Melbourne. Claes, C., Hove, G. v., Loon, J. v., Vandevelde, S., & Schalok, R. L. (2010). Quality of life measurement in the filed of intellectual disabilities: Eight principles for assessing quality of life - Related Personal Outcomes. Social Indicators Research, 95(1), Clarke, P., Black, S., Badley, E., Lawrence, J., & Williams, J. (1999). Handicap in stroke survivors. Disability and Rehabilitation, 21(3), doi: doi: / Clarke, P., Marshall, V., Black, S. E., & Colantonio, A. (2002). Well-Being after stroke in Canadian seniors: Findings from the Canadian study of health and aging. Stroke, 33(4), doi: /01.str f9 CPRO. (2007). About the World Health Organisation Quality of Life (WHOQOL) Project Retrieved 05/01, 2011, from Cranfill, T. B., & Wright, H. H. (2010). Importance of health-related quality of life for persons with aphasia, their significant others, and SLPs: Who do we ask? Aphasiology, 24(6), Cruice, M. (2007). Issues of access and inclusion with aphasia. Aphasiology, 21(1), 3-8. doi: / Cruice, M., Hill, R., Worrall, L., & Hickson, L. (2010). Conceptualising quality of life for older people with aphasia. Aphasiology, 24(3), Cruice, M., Hirsch, F., Worrall, L., Holland, A., & Hickson, L. (2000). Quality of life for people with aphasia: Performance on and usability of quality of life assessments. Asia Pacific Journal of Speech, Language and Hearing, 5, Cruice, M., Worrall, L., & Hickson, L. (2000). Quality of life measurement in speech pathology and audiology. Asia Pacific Journal of Speech, Language and Hearing, 5(1), Cruice, M., Worrall, L., & Hickson, L. (2006). Perpectives of quality of life by people with aphasia and their family: Suggestions for successful living. Topics in Stroke Rehabilitation, 13(1), Cruice, M., Worrall, L., & Hickson, L. (2010). Health-related quality of life in people with aphasia: Implications for fluency disorders quality of life research. Journal of Fluency Disorders, 35(3), doi: /j.jfludis Cruice, M., Worrall, L., Hickson, L., & Murison, R. (2003). Finding a focus for quality of life with aphasia: Social and emotional health, and psychological well-being. Aphasiology, 17(4), Cruice, M., Worrall, L., Hickson, L., & Murison, R. (2005). Measuring quality of life: Comparing family members' and friends' ratings with those of their aphasic partners. Aphasiology, 19(2), Cruz, L. N., Polanczyk, C. A., Camey, S. A., Hoffmann, J. F., & Fleck, M. P. (2011). Quality of life in Brazil: normative values for the Whoqol-bref in a southern general population sample. Quality of Life Research, 20(7), doi: /s Cummins, R. A. (2005). Moving from the quality of life concept to a theory. Journal of Intellectual Disability Research, 49(10), Dalkey, N. C., Rourke, D. L., Lewis, R., & Snyder, D. (1972). Studies in the Quality of Life. Lexington: Lexington Books. Damásio, A. R. (1973). Perturbações neurológicas da linguagem e de outras funções simbólicas. PhD, Faculdade de Medicina de Lisboa, Lisbon. Denman, A. (1998). Determining the needs of spouses caring for aphasic partners. Disability and Reabilitation, 20(11), Donelan, K., Hill, C. A., Hoffman, C., Scoles, K., Feldman, P. H., Levine, C., & Gould, D. (2002). Challenged to care: Informal caregivers in a changing health system. Health Affairs, 21(4), doi: /hlthaff Brígida Patrício 138
139 References Duncan, P. W., Wallace, D., Lai, S. M., Jonhson, D., Embretson, S., & Laster, L. J. (1999). The Stroke Impact Scale Version 2.0: Evaluation of reliability, validity and sensitivity to change. Stroke, 30(10), Engell, B., Hütter, B.-O., Willmes, K., & Huber, W. (2003). Quality of life in aphasia: Validation of a pictorial self-rating procedure. Aphasiology, 17(4), EuroQolGroup. (1990). EuroQol: A new facility for the measurement of health-related quality of life. Health policy, 16(3), Exel, N. J. A., Koopmanschap, M. A., & van den Berg, B. (2005). Burden of informal caregiving for stroke patients: Identification of caregivers at risk of adverse health effects. Cerebrovascular Diseases, 19(1), Farquhar, M. (1995). Elderly people's definitions of quality of life. Social Science & Medicine, 41(10), doi: Doi: / (95)00117-p Fayers, P., & Machin, D. (2007). Quality of life: The assessment, analysis and interpretation of patient-reported outcomes (2ª ed.). England: Wiley. Ferrans, C., & Powers, M. (1985). Quality of Life Index: Development and psychometric properties. Advances in Nursing Science, 8(1), Ferro, J. M. (1986). Neurologia do comportamento: Estudo de correlação com a tomografia axial computorizada. PhD, Faculdade de Medicina de Lisboa, Lisbon. Field, A. (2009). Discovering statistics using SPSS (3rd ed.). London: Sage. Fleck, M. (2008). Problemas conceituais em qualidade de vida. In M. P. A. Fleck, A. F. B. S. Lima, C. A. Polanczyk, C. M. Trentini, D. Bandeira, D. L. Patrick, E. Chachamovich, E. Heldt, F. K. Gazalle, F. Kapczinski, G. G. Manfro, J. J. Zimmermann, J. Bickenbach, J. S. Pargendler, J. K. Brenner, L. C. Wagner, M. T. Berlim, M. A. K. Caldieraro, M. Power, N. S. Rocha, R. G. Panzini, R. Zimpel, S. Schmidt & S. Chatterji (Eds.), Avaliação da qualidade de vida: Guia para profissionais de Saúde (pp ). Porto Alegre: Artmed. Fleck, M., Chachamovich, E., & Trentini, C. (2006). Development and validation of the Portuguese version of the WHOQOL-OLD module. Revista Saúde Pública, 40(5), Fleck, M., Leal, O. F., Louzada, S., Xavier, M., Chachamovich, E., Vieira, G.,... Pinzon, V. (1999). Desenvolvimento da versão portuguesa do instrumento de avaliação de qualidade de vida da OMS (WHOQOL-100). Revista Brasileira de Psiquiatria, 21(1), Fleck, M., Louzada, S., Xavier, M., Chachamovich, E., Vieira, G., Santos, L., & Pinzon, V. (1999). Aplicação da versão em português do instrumento de avaliação de qualidade de vida da Organização Mundial de Saúde (WHOQOL-100). Revista de Saúde Pública, 33(2), Fleck, M., Louzada, S., Xavier, M., Chachamovich, E., Vieira, G., Santos, L., & Pizon, V. (2000). Aplicação da versão em português do instrumento abreviado de avaliação da qualidade de vida WHOQOL-Bref. Revista Saúde Pública, 34(2), Folstein, M. F., Folstein, S. E., & McHugh, P. R. (1975). Mini-Mental State: A practical method for grading the cognitive state of patients for the clinician. Journal of Psychiatric Research(12), Franzén-Dahlin, Å., Laska, A.-C., Larson, J., Wredling, R., Billing, E., & Murray, V. (2008). Predictors of life situation among significant others of depressed or aphasic stroke patients. [Article]. Journal of Clinical Nursing, 17(12), doi: /j x Gameiro, S., Canavarro, M. C., Pereira, M., Serra, A. V., Paredes, T., Carona, C.,... Rijo, D. (2010). Factores sociais e demográficos de variabilidade da qualidade de vida na população geral. In M. C. Canavarro & A. V. Serra (Eds.), Qualidade de vida e saúde: Uma abordagem na perspectiva da Organização Mundial de Saúde (pp ). Lisboa: Fundação Caloouste Gulbenkian: Serviço de Educação e Bolsas. Gargano, J. W., Reeves, M. J., & Investigators, P. C. N. A. S. R. M. P. (2007). Sex differences in stroke recovery and stroke-specific quality of life: Results from a statewide stroke registry. Stroke, 38(9), doi: /strokeaha Brígida Patrício 139
140 References Gill, D., Chang, Y.-K., Murphy, K., Speed, K., Hammond, C., Rodriguez, E.,... Shang, Y.-T. (2010). Quality of life assessment for physical activity and health promotion. Applied Research in Quality of Life, doi: /s Ginieri-Coccossis, M., Triantafillou, E., Tomaras, V., Liappas, I., Christodoulou, G., & Papadimitriou, G. (2009). Quality of life in mentally ill, physically ill and healthy individuals: The validation of the Greek version of the World Health Organization Quality of Life (WHOQOL-100) questionnaire. Annals of General Psychiatry, 8(1), doi: / x-8-23 Glozman, J. M. (2004). Quality of life of caregivers. Neuropsychology Review, 14(4), doi: /s Gonçalves, B., & Fagulha, T. (2004). The Portuguese version of the center for epidemiologic studies depression scale (CES-D). European Journal of Psycological Assessment, 20(4), Goodglass. (1993). Undertanding aphasia. San Diego: Academic Press. Goodglass, & Kaplan. (1972). The assesment of aphasia and related disorders. Philadelphia: Lea & Febiger. Grant, J. S., Elliot, T. R., Giger, J. N., & Bartolucci, A. A. (2001). Social problem solving abilities, social support, and adjustment among family caregivers of individuals with stroke. Rehabilitation Psychology, 46, Grawburg, M., Howe, T., Worrall, L., & Scarinci, N. (2012). A systematic review of the positive outcomes for family members of people with aphasia. Evidence-Based Communication Assessment and Intervention, (3), Grawburg, M., Howe, T., Worrall, L., & Scarinci, N. (2013a). A qualitative investigation into thirdparty functioning and third-party disability in aphasia: Positive and negative experiences of family members of people with aphasia. Aphasiology, 27(7), Grawburg, M., Howe, T., Worrall, L., & Scarinci, N. (2013b). Third-party disability in family members of people with aphasia: A systematic review. Disability & Rehabilitation, 35(16), Guillemin, F., Bombardier, C., & Beaton, D. (1993). Cross-cultural adaptation of health-related quality of life measures: literature review and proposed guidelines. Journal of Clinical Epidemiology, 46(12), Haan, R. J., Limburg, M., Van der Meulen, J. H. P., Jacobs, H. M., & Aaronson, N. K. (1995). Quality of life after stroke: Impact of stroke type and lesion location. Stroke, 26(3), Haley, W., Roth, D., Kissela, B., Perkins, M., & Howard, G. (2010). Quality of life after stroke: a prospective longitudinal study. Quality of Life Research, 1-8. doi: /s Hallowell, B., & Chapey, R. (2008). Introduction to language intervention strategies in adult aphasia. In R. Chapey (Ed.), Language intervention strategies in aphaisa and neurogenic communication disorders (5th Edition ed.). New York: Lippincott Williams & Wilkins. Hawthorne, G., Davidson, N., Quinn, K., McCrate, F., Winkler, I., Lucas, R.,... Molzahn, A. (2006). Issues in conducting cross-cultural research: implementation of an agreed international procotol designed by the WHOQOL Group for the conduct of focus groups eliciting the quality of life of older adults. Quality of Life Research, 15(7), doi: /s Hawthorne, G., Herrman, H., & Murphy, B. (2006). Interpreting the WHOQOL-Brèf: Preliminary population norms and effect sizes. Social Indicators Research, 77(1), doi: /s Haywood, K. L., Garratt, A. M., & Fitzpatrick, R. (2005). Quality of life in older people: A structured review of generic self-assessed health instruments. Quality of Life Research, 14(7), doi: /s Brígida Patrício 140
141 References Hemsley, G., & Code, C. (1996). Interactions between recovery in aphasia, emotional and psychosocial factors in subjects with aphasia, their significant others and speech pathologists. Disability & Rehabilitation, 18(11), Heuvel, E. T., Witte, L. P., Stewart, R. E., Schure, L. M., Sanderman, R., & Meyboom-de Jong, B. (2002). Long-term effects of a group support program and an individual support program for informal caregivers of stroke patients: which caregivers benefit the most? Patient Education and Counseling, 47(4), doi: Hickey, J. V. (2001). The clinical practice of neurological and neurosurgical nursing. New York: Lippincott Company. Hilari, K., Byng, S., Lamping, D., & Smith, S. (2003). Stroke and aphasia quality of life scale-39 (SAQOL-39): Evaluation of acceptability, reliability and validity. Stroke, 34, Hilari, K., Needle, J. J., & Harrison, K. L. (2012). What are the important factors in health-related quality of life for people with aphasia? A systematic review. Archives of Physical Medicine and Rehabilitation, 93(1, Supplement), S86-S95.e84. doi: /j.apmr Hilari, K., Owen, S., & Farrely, S. J. (2007). Proxy and self-report agreement on the Stroke and Aphasia Quality of Life Scale-39 Journal of Neurology, Neurosurgery and Psychiatry, 78, Hilari, K., Wiggins, R., Roy, P., Byng, S., & Smith, S. (2003). Predictors of health-related quality of life (HRQL) in people with chronic aphasia. Aphasiology, 17(4), doi: / Hinckley, J. J. (1998). Investigating the predictors of lifestyle satisfaction among younger adults with chronic aphasia. Aphasiology, 12(7-8), doi: / Holland, A. (2006). Living successfully with aphasia: Three variations on the theme. Topics in Stroke Rehabilitation, 13(1), doi: /13d7-r31r-8a0d-y74g Holmes, S. (2005). Assessing the quality of life--reality or impossible dream?: A discussion paper. International Journal of Nursing Studies, 42(4), doi: DOI: /j.ijnurstu Howe, T., Davidson, B., Worrall, L., Hersh, D., Ferguson, A., Sherratt, S., & Gilbert, J. (2012). 'You need to rehab... families as well': family members'own goals for aphasia rehabilitation. International Journal of Language and Communication Disorders, 47(5), Hsieh, C.-M. (2008). The relative importance of health. Social Indicators Research, 87(1), doi: /s y Huang, C., Wu, A. W., & Frangakis, C. (2006). Do the SF-36 and WHOQOL-BREF measure the same constructs? Evidence from the Taiwan population. Quality of Life Research, 15(15-24). Hula, W. D., Fergadiotis, G., & Doyle, P. J. (2014). A core outcome set for aphasia treatment research: Obstacles, risks, and benefits. Aphasiology, 28(11), doi: / Hunt, S. M., McKenna, S. P., McEwen, J., Williams, J., & Papp, E. (1981). The Nottingham Health Profile: Subjective health status and medical consultations. Social Science & Medicine, 15A(3), Hutchinson, A., Bentzen, N., & Konig-Zahn, C. E. (1997). Cross cultural health outcome assessment: A user s guide. Ruinen: European Research Group on Health Outcomes. INE. (2012). Census Portugal: Instituto Nacional de Estatística. Iwasaki, Y. (2007). Leisure and quality of life in an international and multicultural context: what are major pathways linking leisure to quality of life? Social Indicators Research, 82(2), doi: /s z Jaracz, K., & kozubsky, W. (2003). Quality of life in stroke patients. Acta Neurologica Scandinavica, 107, Brígida Patrício 141
142 References Jeng-Ru, L., Hills, G. A., Kaplan, S., & Johnson, P. M. (1998). Burden among caregivers of stroke patients in taiwan. Topis in Geriatric Rehabilitation, 14(1), Jesus, L., Marques, A., Roberto, M., Rosa, M., & Patrício, B. (In Press-a). Barthel Index (BI) Versão Portuguesa Jesus, L., Marques, A., Roberto, M., Rosa, M., & Patrício, B. (In Press-b). Frenchay Activities Index (FAI) Versão Portuguesa Jonsson, A.-C., Lindgren, I., Hallstrom, B., Norrving, B., & Lindgren, A. (2005). Determinants of Quality of Life in Stroke Survivors and Their Informal Caregivers. Stroke, 36(4), doi: /01.str Jordan, L., & Kaiser, W. (1996). Aphasia: A social approach. London: Chapman & Hall. Kalfoss, M., Low, G., & Molzahn, A. (2008). The suitability of the WHOQOL BREF for Canadian and Norwegian older adults. European Journal of Ageing, 5(1), doi: /s z Kalra, L., Evans, A., I., P., Melbourn, A., Patel, A., Knapp, M., & Donaldson, N. (2004). Training carers of stroke patients: randomised controlled trial. British Medical Journal, 328(7448), Kartsona, A., & Hilari, K. (2007). Quality of life in aphasia: Greek adaptation of the stroje and aphasia quality of life scale-39 item (SAQOL-39). Europa Medicophysica, 43, Khanna, D., & Tsevat, J. (2007). Health-related quality of life: An introduction American Journal Managed Care (Vol. 13, pp. S218-S223). Kim, P., Warren, S., Madill, H., & Hadley, M. (1999). Quality of life of stroke survivors. Quality of Life Research, 8(4), doi: /a: King, R. B. (1996). Quality of Life After Stroke. Stroke, 27(9), Kitzmuller, G., Asplund, K., & Haggstrom, T. (2012). The long-term experience of family life after stroke. Journal of Neuroscience Nursing, 44(1), E1-E13. Kong, K. H., & Yang, S. Y. (2006). Health related quality of life among chronic stroke survivors attending a rehabilitation clinic. Singapore Medical Journal, 47(3), Kranciukaite, D., & Rastenyte, D. (2006). Measurement of quality of life in stroke patients. Medicina (Kaunas), 42(9), Kulkarni, J. R., Chamberlain, M. A., & Porrit, R. (1992). Dependency in rehabilitation: A comparative study of dependency in hospital at home. International Journal of Rehabilitation Reseach, 15(1), Labi, M. L., Phillips, T. F., & Greshman, G. E. (1980). Psychosocial disability in physically restored long-term stroke survivors. Archives of Physical Medicine & Reabilitation, 61(12), LaPointe, L. L. (2005). Foundations: Adaptation, accommodation, aristos. In L. L. LaPointe (Ed.), Aphasia and related neurogenic language disorders (3ª ed., pp. 1-18). New York: Thieme. Larsen, J. K., Vermulst, A. A., Geenen, R., van Middendorp, H., English, T., Gross, J. J.,... Engels, R. C. M. E. (2013). Emotion Regulation in Adolescence: A Prospective Study of Expressive Suppression and Depressive Symptoms. The Journal of Early Adolescence, 33(2), doi: / Lata-Caneda, M. C., Piñeiro-Temprano, M., García-Armesto, I., Barruego-Egido, J. R., & Meijide- Failde, R. (2009). Spanish adaptation of the Stroke and Aphasia Quality of Life Scale-39 (SAQOL-39). European Journal of Physical and Rehabilitation Medicine, 45(3), Lawrence, M., Kerr, S., Watson, H., Paton, G., & Ellis, G. (2010). An exploration of lifestyle beliefs ans lifestyle behaviour following stroke: Findings from a focus group study of patients and family members. BMC Family Practice, 11(97). Le Dorze, G., Brassard, C., Larfeuil, C., & Allaire, J. (1996). Auditory comprehension problems in aphasia from the perspective of aphasic persons and their families and friends. Disability and rehabilitation, 18(11), Brígida Patrício 142
143 References Le Dorze, G., & Signori, F.-H. (2010). Needs, barriers and facilitators experienced by spouses of people with aphasia. [Article]. Disability & Rehabilitation, 32(13), doi: / Le Dorze, G., Tremblay, V., & Croteau, C. (2009). A qualitative longitudinal case study of a daughter's adaptation process to her father's aphasia and stroke. Aphasiology, 23(4), doi: / Lenderking, W. R. (2005). The Psychology of Quality of Life. Quality of Life Research, 14(5), doi: /s Leung, K. F., Wong, W. W., Tay, M. S., Chu, M. M., & Ng, S. S. (2005). Development and validation of the interview version of the Hong Kong Chinese WHOQOL-BREF. Quality of Life Research, 14(5), doi: /s Leung, L., & Lee, P. S. (2005). Multiple determinants of life quality: the roles of Internet activities, use of new media, social support, and leisure activities. Telematics and Informatics, 22(3), doi: DOI: /j.tele Levasseur, M., Desrosiers, J., & Tribble, D. (2008). Do quality of life, participation and environment of older adults differ according to level of activity? Health and Quality of Life Outcomes, 6(1), doi: / Levasseur, S., Green, S., & Talman, P. (2005). The SEIQoL-DW is a valid method for measuring individual quality of life in stroke survivors attending a secondary prevention clinic. Quality of Life Research, 14(3), doi: /s x Li, L., Young, D., Xiao, S., Zhou, X., & Zhou, L. (2004). Psychometric properties of the WHO Quality of Life questionnaire (WHOQOL-100) in patients with chronic diseases and their caregivers in China. Bulletin of the Worl Health Organization, 82(7), Liang, W.-M., Chang, C.-H., Yeh, Y.-C., Shy, H.-Y., Chen, H.-W., & Lin, M.-R. (2009). Psychometric evaluation of the WHOQOL-BREF in community-dwelling older people in Taiwan using Rasch analysis. Quality of Life Research, 18(5), doi: /s Lloyd, K. M., & Auld, C. J. (2002). The role of leisure in determining quality of life: Issues of content and measurement. Social Indicators Research, 57(1), doi: /a: MacWhinney, B. (2014). Challenges facing COS development for aphasia. Aphasiology, 28(11), doi: / Mahoney, F. I., & Barthel, D. (1965). Functional Evaluation: The Barthel Index. Maryland State Medical Journal, 14, Malheiro, A., Nicola, Â., & Pereira, C. (2009). Contributo para a adaptação e validação da Escala de Avaliação da Qualidade de Vida para Utentes Após AVC (Stroke Specifi Quality of Life Scale: SS-QOL). ESSFisionline, 5(2), Man, D., Yip, P., Ko, T., Kwok, J., & Tsang, M. (2010). Quality of Life of Individuals with Acquired Brain Injuries. Applied Research in Quality of Life, 5(1), doi: /s x Manders, A., Dammekens, E., Leemans, I., & Michiels, K. (2010). Evaluation of quality of life in people with aphasia using a Dutch version of the SAQOL-39. Disability and Reabilitation, 32(3 ), Manders, E., Marien, A., & Janssen, V. (2011). Informing and supporting partners and children of persons with aphasia: a comparison of supply and demand. Logopedics Phoniatrics Vocology, 36(4), Martins, T. (2006). Acidente Vascular Cerebral: Qualidade de vida e bem-estar dos doentes e familiares cuidadores. Coimbra: Formasau - Formações e Saúde Lda. Martins, T., Ribeiro, J. P., & Garret, C. (2003). Estudo de adaptação e validação do Frenchay Activities Index numa amostra de doentes com baixa escolaridade afectados por acidente vascular cerebral. Arquivos de Medicina, 17(1/2/3), Brígida Patrício 143
144 References Matos, M. A., & Jesus, L. M. (2011a). Communication Disability Profile (CDP) - Versão Portuguesa. INPI Registration Number , Boletim da Propriedade Industrial Número 2011/06/02 (106/2011). Matos, M. A., & Jesus, L. M. (2011b). Mini -Mental State Modificado (MMSM). Processo INPI com despacho de concessão em 3/8/2011, inserido no Boletim da Propriedade Industrial Número 2011/08/08 (150/2011); Deferimento pela IGAC em 4/07/2011 Nº 3303/2011. Mayo, N. E., Wood-Dauphinee, S., Robert, C., Durcan, L., & Carlton, J. (2002). Activity, participation, and quality of life 6 months poststroke. Archives of Physical Medicine and Rehabilitation, 83(8), doi: DOI: /apmr McGurk, R., Kneebone, I. I., & Pit ten Cate, I. M. (2011). Sometimes we get it wrong but we keep on trying : A cross-sectional study of coping with communication problems by informal carers of stroke survivors with aphasia. Aphasiology, 25(12), doi: / Michallet, B., Le Dorze, G., & Tétreault, S. (2001). The needs of spouses caring for severely aphasic persons. Aphasiology, 15(8), doi: / Michallet, B., Tétreault, S., & Dorze, G. L. (2003). The consequences of severe aphasia on the spouses of aphasic people: A description of the adaptation process. Aphasiology, 17(9), Molzahn, A., Skevington, S., Kalfoss, M., & Makaroff, K. (2010). The importance of facets of quality of life to older adults: an international investigation. Quality of Life Research, 19(2), doi: /s Moreno, A. B., Faerstein, E., Werneck, G. L., Lopes, C. S., & Chor, D. (2006). Propriedades psicométricas do Instrumento Abreviado de Avaliação da Qualidade de Vida da Organização Mundial de Saúde no estudo Pró-Saúde. Cadernos de Saúde Pública, 22(12), Morimoto, T., Schreiner, A. S., & Asano, H. (2003). Caregiver burden and health-related quality of life among Japanese stroke survivors. Age and Ageing, 32(2), Mota, J. F., & Nicolato, R. (2008). Qualidade de vida em sobreviventes de acidente vascular cerebral - Instrumentos de avaliação e seus resultados. J Bras Psiquiatr, 57(2), Natterlund, B. S. (2010). A new life with aphasia: Everyday activities and social support. Scandinavian Journal of Occupational Therapy, 17(2), Nätterlund, B. S. (2010). Being a close relative of a person with aphasia. [Article]. Scandinavian Journal of Occupational Therapy, 17(1), doi: / Niemi, N. L., Laaksonen, R., Kotila, M., & Waltino, O. (1988). Quality of live 4 years after stroke. Stroke, 19, Noerholm, V., Groenvold, M., Watt, T., Bjorner, J. B., Rasmussen, N. A., & Bech, P. (2004). Quality of life in the Danish general population normative data and validity of WHOQOL-BREF using Rasch and item response theory models. Quality of Life Research, 13(2), doi: /B:QURE d6 Nolan, M., Keady, J., & Grant, G. (1995). CAMI: a basis for assessment and support with family carers. British Journal of Adult/Elderly Care Nursing, 1, Nystrom, M. (2011). A bridge between a lonely soul and the sorrounding world: A study on the existential consequences of being a closely related to a person with aphasia. International Journal of Qualitative Studies of Health and Well-being, 6, doi: /qhw.v6i O'Carroll, R. E., Smith, K., Couston, M., Cossar, J. A., & Hayes, P. C. (2000). A comparison of the WHOQOL-100 and the WHOQOL-BREF in detecting change in quality of life following liver transplantation. Quality of Life Research, 9(1), doi: /a: Brígida Patrício 144
145 References O Boyle, C. A. (1997). Measuring the quality of later life. Philosophy Transactions of the Royal Society of London, 352, Oliveira, M. R., & Orsini, M. (2008). Escalas de avalição da qualidade de vida em pacientes brasileiros após acidente vascular encefálico. Revista Neurociências, 17(3), Opara, J. A., & Jaracz, K. (2010). Quality of Life of post-stroke patients and their caregivers. Journal of Medicine and Life. Oyebode, J. (2003). Assessment of Carers psychological needs. Advances in Psychiatric Treatment, 9, Pashek, G. V. (2008). Screening mental status in adults with aphasia using language-modified form of the Mini-Mental State Examination: A preliminary investigation. Journal of Medical Speech-Language Pathology Retrieved 3 May, 2012 Patel, M. D., Tilling, K., Lawrence, E., Rudd, A. G., Wolfe, C. D. A., & McKevitt, C. (2006). Relationships between long-term stroke disability, handicap and health-related quality of life. Age and Ageing, 35(3), doi: /ageing/afj074 Patrício, B. F. (2007). Sintomatologia depressiva em indivíduos com afasia crónica. MSc Thesis, Universidade Católica Portuguesa and Escola Superior de Saúde de Alcoitão, Lisboa, Portugal. Patrick, D. (2008). A qualidade de vida pode ser medida? Como? In M. P. A. Fleck, A. F. B. d. S. Lima, C. A. Polanczyk, C. M. Trentini, D. Bandeira, D. L. Patrick, E. Chachamovich, E. Heldt, F. K. Gazalle, F. Kapczinski, G. G. Manfro, J. J. Zimmermann, J. Bickenbach, J. S. Pargendler, J. K. Brenner, L. C. Wagner, M. T. Berlim, M. A. K. Caldieraro, M. Power, N. S. Rocha, R. G. Panzini, R. Zimpel, S. Schmidt & S. Chatterji (Eds.), Avaliação da qualidade de vida: Guia para profissionais de Saúde. Porto Alegre: Artmed. Peña-Casanova, J., Manero, R. M., & Bertran-Serra, I. (1995). Aspectos psicológicos neuropsiquiátricos y conductuales de los afásicos. Aspectos sociales y terapia en grupo. In J. Peña-Casanova & M. P. Pamies (Eds.), Rehabilitación de la Afasia y Transtornos Asociados (2nd ed., pp ). Barcelona: Masson. Phillips, D. (2006). Quality of life: Concept, policy and practice. New York: Routledge - Taylor & Francis Group. Pimentel, F. L. (2006). Qualidade de vida e oncologia. Coimbra: Almedina. Portero-McLellan, K. C., Rocha, A. J., Sakzenian, W. B., & Panhoca, I. (2009). Avaliação da qualidade de vida em pacientes afásicos. Cadernos da Saúde Colectiva, 17(2), Posteraro, L., Formis, A., Bidini, C., Grassi, E., Curti, M., Bighi, M.,... Franceschini, M. (2004). Aphasia quality of life: Reliability of the Italian version of SAQOL-39. Europa Medicophysica, 40(4), Posteraro, L., Formis, A., Grassi, E., Bighi, M., Nati, P., Bocchini, C. P.,... Franceschini, M. (2006). Quality of life and aphasia. Multicentric standardization of a questionnaire. Europa Medicophysica, 42(3), Pound, C., Parr, S., & Duchan, J. (2001). Using partners' autobiographical reports to develop, deliver, and evaluate services in aphasia. Aphasiology, 15(5), Pound, C., Parr, S., Lindsay, J., & Woolf, C. (2000). Beyond aphasia: Therapies for living with communication disability. United Kingdom: Speechmark Publishing Ltd. Power, M., Quinn, K., Schmidt, S., & WHOQOLGroup. (2005). Development of the WHOQOL-Old Module. Quality of Life Research, 14(10), doi: /s Radloff, L. (1977). The CES-D Scale: a self-report depression scale for research in the general population. Applied Psychological Measurement, 1, Reif, K., Marbeau, Y., Quatresooz, J., & Vancraeynest, D. (1991). Harmonization of demographics: Eurodemographics? Nearly There! Luxembourg: European Society for Opinion and Marketing Research. Brígida Patrício 145
146 References Ribeiro, C. (2008). Avaliação da qualidade de vida em pacientes afásicos com protocolo específico SAQOL-39. MSc Thesis, Faculdade de Medicina da Universidade de São Paulo, São Paulo, Brasil. Robinson, J., & Martin, S. (2008). What do happy people do? Social Indicators Research, 89(3), doi: /s Rodrigues, I. T., & Leal, M. G. (2013). Tradução portuguesa e análise de aspectos psicométricos da escala "Stroke and Aphasia Quality of Life Scale-39 (SAQOL-39)". Audiology - Communication Research, 18(4), Rombough, R., Howse, E., Bagg, S., & Bartfay, W. (2007). A comparison of studies on the quality of life of primary caregivers of stroke survivors: A systematic review of the literature. Topics in Stroke Rehabilitation, 14(3), doi: /tsr Rombough, R., Howse, E. L., & Bartfay, W. J. (2006). Caregiver strain and caregiver burden of primary caregivers of stroke survivors with and without aphasia. Rehabilitation Nursing, 31(5), doi: /j tb00136.x Ross, K., & Wertz, R. (2002). Relationships between language-based disability and quality of life in chronically aphasic adults. Aphasiology, 16(8), Ross, K., & Wertz, R. (2003). Quality of life with and without aphasia. Aphasiology, 17(4), Santos, M. E., Farrajota, M. L., Caldas, A. C., & Sousa, L. D. (1999). Problems of patients with chronic aphasia: different perspectives of husbands and wives? [Article]. Brain Injury, 13(1), doi: / Sarno, M. T. (1997). Quality of life in aphasia in the first post-stroke year. Aphasiology, 11(7), doi: / Saxena, S., Carlson, D., Billington, R., & Orley, J. (2001). The WHO quality of life assessment instrument (WHOQOL-Bref): The importance of its items for cross-cultural research. Quality of Life Research, 10(8), doi: /a: Scholte op Reimer, W. J., de Haan, R., Rijnders, P., Limburg, M., & van den Bos, G. A. (1998). The burden of caregiving in partners of long-term stroke survivors. Stroke, 29, Serra, A. V., Canavarro, M. C., Simões, M. R., Pereira, M., Gameiro, S., Quartilho, M. J.,... Paredes, T. (2006). Estudos psicométricos do instrumento de avaliação da qualidade de vida da Organização Mundial de Saúde (WHOQOL-Bref) para português de Portugal. Psiquiatria Clínica, 27(1), Shinar, D., Gross, C. R., Bronstein, K. S., Licata-Gehr, E. E., Eden, D. T., R., C. A.,... Kunitz, S. C. (1987). Reliability of the activities of daily living scale and its use in telephone interview. Archives of Physical Medicine & Reabilitation, 68( ). Simpson, C., & Carter, P. (2013). Mastery: A comparison of wife and daughter caregivers of a person with dementia. Journal of Holistic Nursing, 20(10), 1-8. doi: / Singh, R., & Dixit, S. (2010). Health-related quality of life and health management. Journal of Health Management, 12(2), Sinoff, G., & Ore, L. (1997). The Barthel Activities of Daily Living Index: self-reporting versus actual performance in the old-old (> 75 years). Journal of the American Geriatrics Society, 45, Skevington, S., Lofty, M., & O'Connel, K. A. (2004). The World Health Organization's WHOQOL-Bref quality of life assessment: Psychometric properties and results of the international field trial. A report from WHOQOL Group. Quality of Life Research, 13(2), Sorin-Peters, R. (2003). Viewing couples living with aphasia as adult learners: Implications for promoting quality of life. Aphasiology, 7(4), Spagnoli, P., Caetano, A., & Silva, A. (2012). Psychometric properties of a Portuguese version of the Subjective Happiness Scale. Social Indicators Research, 105(1), doi: /s Brígida Patrício 146
147 References Straten, A., Haan, R. J., Limburg, M., & Bos, G. (2000). Clinical meaning of the Stroke Adapted Sickness Impact Profile-30 and the Sickness Impact Profile-136. Stroke, 31(11), Swinburn, K., & Byng, S. (2006). The Communication Disability Profile. London: Connect, The Communication Disability Network. Tang, Y., & Chen, S. (2002). Health promotion behaviors in Chinese family caregivers of patients with stroke. Health Promotion International, 17(4), Tengs, T. O., Yu, M., & Luistro, E. (2001). Health-related quality of life after stroke. Stroke, 32, Threats, T. (2010). The ICF framework and third party disability: Application to the spouses of persons with aphasia. Topics in Stroke Rehabilitation, 17(6), doi: /tsr Tobin, C., Hevey, D., Horgan, N., Coen, R., & Cunningham, C. (2008). Health-related quality of life of stroke survivors attending the volunteer stroke scheme. Irish Journal of Medical Science, 177(1), doi: /s Tombaugh, T. N., & McIntyre, N. J. (1992). The Mini-Mental State Exam: A comprehensive review. Journal of the American Geriatrics Society(40), Unalan, D., Soyuer, F., Ozturk, A., & Mistik, S. (2008). Comparison of SF-36 and WHOQOL-100 in patients with stroke. Neurology India, 56(4), Retrieved from Usefy, A., Ghassemi, G., Sarrafzadegan, N., Mallik, S., Baghaei, A., & Rabiei, K. (2010). Psychometric properties of the WHOQOL-BREF in an Iranian adult sample. Community Mental Health Journal, 46(2), doi: /s Veenhoven, R. (2000). The four qualities of fife. Journal of Happiness Studies, 1(1), doi: /a: Verdugo, M. A., Schalock, R. L., Keith, K. D., & Stancliffe, R. J. (2005). Quality of life and its measurement: Important principles and guidelines. Journal of Intellectual Disability Research, 49(10), Wade, D., Legh-Smith, J., & Hewer, R. (1985). Social activities after stroke: Measurement and natural history using the Frenchay Activities Index. International Rehabilitation Medicine, 7, Wahl, A. K., Rustøen, T., Hanestad, B. R., Lerdal, A., & Moum, T. (2004). Quality of life in the general Norwegian population, measured by the Quality of Life Scale (QOLS-N). Quality of Life Research, 13(5), doi: /B:QURE b Währborg, P. (1991). Assessment and management of emotional and psychosocial reactions to brain damage and aphasia. San Diego: Singular Publishing Group. Wallace, S. J., Worrall, L., Rose, T., & Le Dorze, G. (2014). Measuring outcomes in aphasia research: A review of current practice and an agenda for standardisation. Aphasiology, 28(11), doi: / Wang, W.-C., Yao, G., Tsai, Y.-J., Wang, J.-D., & Hsieh, C.-L. (2006). Validating, improving reliability, and estimating correlation of the four subscales in the WHOQOL-BREF using multidimensional rasch analysis. Quality of Life Research, 15(4), doi: /s WGISPC. (1996). Social statistics: Follow-up to the world summit for social development (E. a. S. Council, Trans.) (18th ed.). New York: United Nations. White, C. L., Lauzon, S., Yaffe, M. J., & Wood-Dauphinee, S. (2004). Toward a model of quality of life for family caregivers of stroke survivors. Quality of Life Research, 13(3), doi: /B:QURE f White, C. L., Mayo, N., Hanley, J. A., & Wood-Dauphinee, S. (2003). Evolution of the caregiving experience in the initial 2 years following stroke. Research in Nursing & Health, 26(3), doi: /nur Brígida Patrício 147
148 References WHO. (1996). WHOQOL-Bref: Introduction, administration, scoring and generic version of the assessment: Programe on Mental Health of World Health Organization. WHO. (1997). WHOQOL: Measuring quality of life. Geneva: World Health Organization. WHO. (1998). Health promotion glossary. Geneva: World Health Organization. WHO. (s.d.). WHO Quality of Life-BREF (WHOQOL-BREF) Retrieved , 2011, from WHOQOLGroup. (1993). Study protocol for the World Health Organization project to develop a quality of life assessment instrument (WHOQOL). Quality of Life Research, 2, Wild, D., Grove, A., Martin, M., Eremenco, S., McElroy, S., Verjee-Lorenz, A., & Erikson, P. (2005). Principles of good practice for the translation and cultural adaptation process for patientreported outcomes (PRO) Measures: Report of the ISPOR task force for translation and cultural adaptation. Value in Health, 8(2), Wilkinson, P. R., Wolfe, C. D. A., Warburton, F. G., Rudd, A. G., Howard, R. S., Ross-Russell, R. W., & Beech, R. R. (1997). A long-term follow-up of stroke patients. Stroke, 28(3), Williams, L., Weinberger, M., Harris, L. E., Clark, D. O., & Biller, J. (1999). Development of a strokespecific quality of life scale. Stroke, 30, Williams, S. (1993). The impact of aphasia on marital satisfaction. Archives of Physical Medicine & Reabilitation, 74(4), Willige, G. v., Wiersma, D., Nienhuis, F. J., & Jenner, J. A. (2005). Changes in quality of life in chronic psychiatric patients: A comparison between EuroQol (EQ-5D) and WHOQoL. Quality of Life Research, 14(2), doi: /s y Worrall, L., Brown, K., Cruice, M., Davidson, B., Hersh, D., Howe, T., & Sherratt, S. (2010). The evidence for a life-coaching approach to aphasia. Aphasiology, 24(4), doi: / Worrall, L., & Hickson, L. (2003). Communication disability in aging: From prevention to intervention. Canada: Thomson Delmar Learning. Worrall, L., & Holland, A. (2003). Editorial: Quality of life in aphasia. Aphasiology, 17(4), doi: / Yao, G., & Wu, C.-h. (2009). Similarities and differences among the Taiwan, China, and Hong-Kong versions of the WHOQOL questionnaire. Social Indicators Research, 91(1), doi: /s Yao, G., Wu, C.-h., & Yang, C.-t. (2008). Examining the content validity of the WHOQOL-BREF from respondents perspective by quantitative methods. Social Indicators Research, 85(3), doi: /s Zemva, N. (1999). Aphasic patients and their families: wishes and limits. Aphasiology, 13(3), Brígida Patrício 148
149
150 Author s relevant publications Author s relevant publications Patricio, B.F., L. Jesus, M. Cruice, and A. Hall (2014). Quality of Life Predictors and Normative Data. Social Indicators Research. doi: /s Patricio, B.F., L. Jesus, M. Cruice, and A. Hall (2013). Influências na qualidade de vida de pessoas com afasia em Portugal. In Atas das Jornadas de Iniciação à Investigação Clínica do Centro Hospitalar do Porto, Porto, Portugal. Patricio, B.F., L. Jesus, M. Cruice, and A. Hall (2012). Limitations of the social relationships domain of WHOQOL-Bref. Quality of Life Research 21(Supplement 1), 101. Patricio, B.F., L. Jesus, M. Cruice, and A. Hall (2012). Quality of life predictors for Portuguese general population. Quality of Life Research 21(Supplement 1), Patricio, B.F., L. Jesus, M. Cruice, and A. Hall (2012). Assessing quality of life in aphasia: The benefits and limitations of the WHOQOL-Bref in therapy planning for aphasia in Portugal. In Proceedings of the British Aphasiology Society (BAS) Therapy Symposium, London, UK, p. 31. Brígida Patrício 150
151
152 Appendixes APPENDIXES Brígida Patrício 152
153
154 Appendixes Appendix A: World Health Organization Quality of Life Scale - Bref (WHOQOL-Bref) Brígida Patrício 154
155
156
157
158
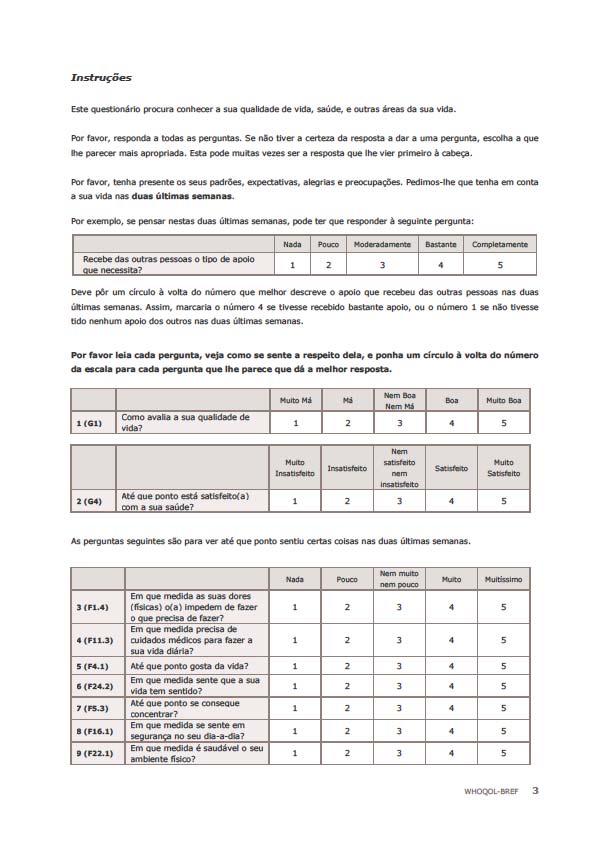
159
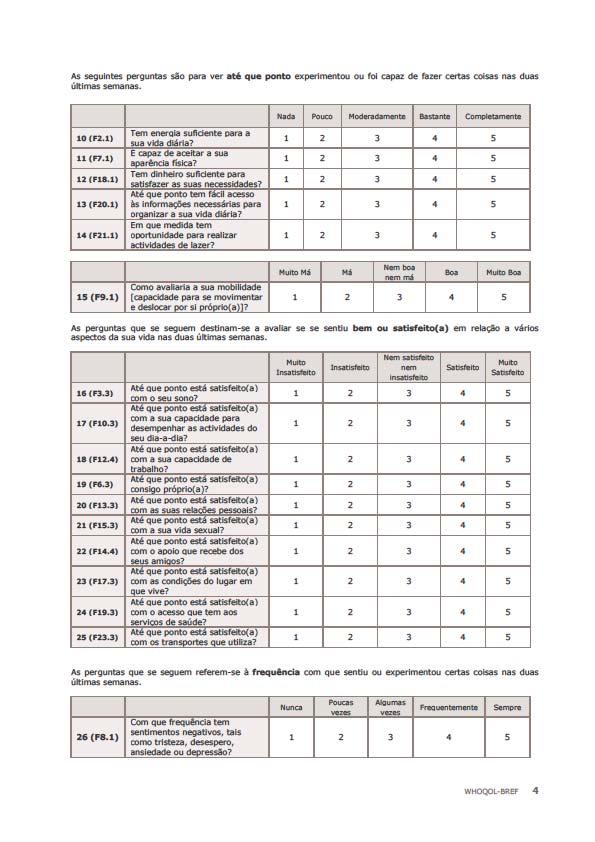
160
161 Appendixes Appendix B: World Health Organization Quality of Life Scale 100 (WHOQOL-100) Social Relationships domain Brígida Patrício 161
162
163 WHOQOL-100 Domínio das Relações Sociais As perguntas que se seguem foram extraídas do instrumento WHOQOL-100, domínio 4, e procuram conhecer a forma como classifica as suas relações sociais. Irá encontrar algumas perguntas às quais já respondeu no instrumento WHOQOL-Bref. É importante que responda novamente. Na resposta às questões, considere as suas duas últimas semanas. As perguntas seguintes destinam-se a avaliar até que ponto experimentou certas coisas nas duas últimas semanas. Ponha um círculo à volta do número correspondente à intensidade do que sentiu. Nada Pouco Nem muito nem pouco Muito Muitíssimo 1 (F13.1) Até que ponto se sente só na vida? (F15.2) Em que medida são satisfeitas as suas necessidades sexuais? 3 (F15.4) Sente-se incomodado por quaisquer dificuldades na sua vida sexual? Nada Pouco Moderadamente Bastante Completamente 4 (F14.1) Recebe das outras pessoas o tipo de apoio que necessita? 5 (F14.2) Em que medida pode contar com os seus amigos quando precisa deles? As perguntas que se seguem destinam-se a avaliar se se sentiu satisfeito(a), feliz ou bem em relação a vários aspectos da sua vida nas duas últimas semanas. Ponha um círculo à volta do número que melhor traduz a maneira como se sente. 6 (F13.3) 7 (F15.3) 8 (F14.3) 9 (F14.4) 10 (F13.4) Até que ponto está satisfeito(a) com as suas relações pessoais? Até que ponto está satisfeito(a) com a sua vida sexual? Até que ponto está satisfeito(a) com o apoio que recebe da sua família? Até que ponto está satisfeito(a) com o apoio que recebe dos seus amigos? Até que ponto está satisfeito(a) com a sua capacidade de ajudar ou apoiar outras pessoas? Muito insatisfeito Insatisfeito Nem satisfeito nem insatisfeito Satisfeito Muito satisfeito (F13.2) Mnh Sente-se feliz com as suas relações familiares? Muito infeliz Infeliz Nem feliz nem infeliz Feliz Muito feliz Muito má Má Nem boa nem má Boa Muito boa 12 (F15.1) Como avalia a sua vida sexual?
164
165 Appendixes Appendix C: Center for Epidemiologic Studies Depression Scale (CES-D) Brígida Patrício 165
166
167 CENTER FOR EPIDEMIOLOGIC STUDIES DEPRESSION SCALE (CES-D) (Gonçalves & Fagulha, 2004) Encontra nesta página uma lista das maneiras como se pode ter sentido ou reagido. Indique com que frequência se sentiu dessa maneira durante a semana passada fazendo uma cruz no quadrado correspondente. Use a seguinte chave: Nunca ou muito raramente (menos de 1 dia) Ocasionalmente (1 ou 2 dias) Com alguma frequência (3 ou 4 dias) Com muita frequência ou sempre (5 ou 7 dias) Durante a semana passada: Nunca ou muito raramente Ocasionalmente Com alguma frequência Com muita frequência ou sempre 1. Fiquei aborrecido com coisas que habitualmente não me aborrecem 2. Não me apeteceu comer; estava sem apetite 3. Senti que não conseguia livrar-me da neura ou da tristeza, mesmo com a ajuda da família ou dos amigos 4. Senti que valia tanto como os outros 5. Tive dificuldade em manter-me concentrado no que estava a fazer 6. Senti-me deprimido 7. Senti que tudo o que fazia era um esforço 8. Senti-me confiante no futuro 9. Pensei que a minha vida tinha sido um fracasso 10. Senti-me com medo 11. Dormi mal 12. Senti-me feliz 13. Falei menos do que o costume 14. Senti-me sozinho
168 15. As pessoas foram desagradáveis ou pouco amigáveis comigo 16. Senti prazer ou gosto na vida 17. Tive ataques de choro 18. Senti-me triste 19. Senti que as pessoas não gostavam de mim 20. Senti falta de energia
169 Appendixes Appendix D: Sociodemogaphic datasheet for Portuguese general population Brígida Patrício 169
170
171 Dados Pessoais Adicionais Por favor, preencha cada um dos espaços com uma cruz (x) ou com a informação solicitada. 1 Nacionalidade 2 Ocupação Empregado Desempregado Reformado Voluntário 3 Habita com Sozinho Cônjuge Filho(s) Com quantos filhos vive? Pai Mãe Irmão(ãos) Com quantos irmãos vive? Sogro Sogra Nora Genro Outro(s) Quais? Quantas são as outras pessoas que vivem consigo? Considere agora a pessoa com maior rendimento no seu agregado familiar. Coloque uma cruz (x) no grupo ocupacional a que essa pessoa pertence*. 4 Grupo ocupacional Patrão/proprietário (agricultura, comércio, indústria, serviços) de empresa/loja/exploração com 6 ou mais trabalhadores Quadro superior (responsável por 6 ou mais trabalhadores) Quadro superior (responsável por 5 ou menos trabalhadores) Profissão liberal ou similar Quadro médio (responsável por 6 ou mais trabalhadores) Patrão/proprietário (agricultura, comércio, indústria, serviços) de empresa/loja/exploração com 5 ou menos trabalhadores Profissão técnica, científica e artística por conta de outrem Quadro médio (responsável por 5 ou menos trabalhadores) Empregado de escritório Estudante, doméstica, inactivo Empregado trabalhando sem ser em escritório Trabalhador manual ou similar por conta própria Desempregado Trabalhador manual por conta de outrem * Nota: Caso a pessoa considerada tenha várias actividades, considere a actividade principal de onde resultam os rendimentos. Caso a pessoa seja reformada, considere a actividade ocupacional relativa à actividade que exercia antes de se reformar. Vire a página, por favor.
172 Continue a considerar a pessoa com maior rendimento no seu agregado familiar. 5 Escolaridade Não sabe ler nem escrever Sabe ler ou escrever sem possuir diploma 1º Ciclo do Ensino Básico (antiga 4ª classe) 2º Ciclo do Ensino Básico (antigo 6º ano) 3º Ciclo do Ensino Básico (antigo 9º ano) 11º-12º Anos de escolaridade Bacharelato ou frequência de curso superior Licenciatura ou mais Muito Obrigada pela sua colaboração!
173 Appendixes Appendix E: Ethics committee authorization for Portuguese general population s study Brígida Patrício 173
174
175
176
177 Appendixes Appendix F: Study information (Portuguese general population) Brígida Patrício 177
178
179 Exmo(a) Sr(a), Estamos a solicitar a colaboração de pessoas para participarem na realização de um estudo sobre a qualidade de vida das pessoas com afasia e dos seus familiares. Se tem mais de 25 anos, vive em Portugal e tem nacionalidade portuguesa, por favor, participe. Este estudo tem uma finalidade científica e académica, destinando-se à obtenção do grau de Doutor de Ana Brígida Francisco Patrício. Intitula-se Impacto das alterações da comunicação na qualidade de vida das pessoas com afasia e na dos seus familiares e é supervisionado pelo Professor Doutor Luís Miguel Teixeira de Jesus da Universidade de Aveiro e pela Professora Doutora Madeline Cruice da City University. No âmbito desta investigação é necessário recolher dados através de questionários. A análise desses dados vai permitir uma maior compreensão sobre a qualidade de vida da população portuguesa em geral, das pessoas com afasia e dos seus familiares. Isto permitirá, no futuro, conhecer e ajudar, de modo mais eficaz, essas pessoas. Por tudo isto, a sua colaboração é muito importante. Qualquer um dos procedimentos utilizados não causará qualquer prejuízo à sua saúde ou vida. Poderá recusar a sua colaboração, em qualquer momento, sem que daí advenha algum prejuízo. A sua participação implica o preenchimento dos seguintes instrumentos: Versão abreviada da World Health Organization Quality of Life Scale (WHOQOL-Bref); Domínio 3 da WHOQOL-100; Center for Epidemiologic Depression Scale (CES-D); e Ficha de dados pessoais adicionais. No início de cada instrumento, são apresentadas as instruções de preenchimento. Não há respostas certas ou erradas, o importante é a sua opinião. É fundamental que leia atentamente e responda a todas as questões. A primeira página da WHOQOL-Bref será preenchida pela investigadora, pelo que deve ser deixada em branco. Comece, pois, o preenchimento deste instrumento na página onde são solicitados os dados pessoais. O preenchimento de todos os questionários demora cerca de 15 minutos. Todos os dados recolhidos são confidenciais. Caso não saiba ou não consiga ler ou escrever os questionários poderão ser lidos e preenchidos com o auxílio de outra pessoa. Todas as respostas deverão ser registadas de acordo com a opinião do participante. Em caso de dúvida, por favor, contacte a investigadora através do contacto electrónico: bp.afasia@gmail.com. Agradecemos, desde já, a sua participação neste estudo. O seu contributo é muito importante! Muito Obrigada!
180
181 Appendixes Appendix G: Frenchay Activities Index (FAI) Brígida Patrício 181
182
183 Código de participante: PCA- (A preencher pelo investigador) Frenchay Activities Index (FAI) Versão Portuguesa Nome: Data: Coloque o valor correspondente à resposta no espaço apresentado a seguir a cada item. Durante os últimos 3 meses, com que frequência realizou as seguintes atividades: 1. Preparar as refeições principais 2. Lavar a loiça após as refeições 3. Lavar a roupa 4. Trabalhos domésticos leves 5. Trabalhos domésticos pesados 6. Fazer compras perto de casa 7. Eventos sociais 8. Caminhar no exterior 15 minutos 9. Dedicar-se ativamente a um passatempo 10. Conduzir um carro/andar de autocarro 0 = Nunca 1 = Menos de uma vez por semana 2 = 1-2 vezes por semana 3 = Na maioria dos dias 0 = Nunca 1 = 1-2 vezes em 3 meses 2 = 3-12 vezes em 3 meses 3 = Pelo menos uma vez por semana Durante os últimos 6 meses, com que frequência realizou as seguintes atividades: 11. Excursões/passear de carro 0 = Nunca 1 = 1-2 vezes em 6 meses 2 = 3-12 vezes em 6 meses 12. Jardinagem/cuidar do quintal/horta 13. Reparações/manutenção da casa/carro 3 = Pelo menos uma vez por semana 0 = Nunca 1 = Tarefas leves 2 = Tarefas moderadas 3 = Tarefas pesadas/sempre que necessário 14. Ler livros 0 = Nenhum 1 = 1 em 6 meses 2 = Menos de 1 em 2 semanas 3 = Mais de 1 em 2 semanas 15. Trabalho remunerado 0 = Nenhum 1 = Até 10 horas/semana 2 = horas/semana 3 = Mais de 30 horas/semana TOTAL: Frenchay Activities Index (FAI) Versão Portuguesa 1, University of Aveiro, Aveiro, Portugal. Frenchay Activities Index (FAI), Derick Wade, Oxford University Hospitals, Oxford Centre for Enablement (OCE), Oxford, UK.
184 Instruções para a aplicação do Frenchay Activities Index: O Objetivo é avaliar atividades que requerem alguma iniciativa por parte do paciente. É importante que se concentre na frequência real da atividade realizada no passado recente, não no seu desempenho no passado distante nem no seu potencial. Uma atividade apenas pode ser quantificada num item. Informação específica para cada item: 1. Deve fazer parte substancial da organização, preparação e confeção de uma refeição principal. Não apenas refeições ligeiras (como sandes) ou aquecer comida já preparada. 2. Deve fazer tudo ou partilhar em partes iguais, por exemplo, lavar ou secar e arrumar. Não apenas enxaguar um objeto ocasionalmente. 3. Organização da roupa para lavar e secar seja com o uso de máquina de lavar, à mão ou na lavandaria. Partilha a tarefa em partes iguais, por exemplo, colocar/retirar a roupa da máquina, estender e dobrar. 4. Limpar o pó, polir, passar a ferro, arrumar pequenos objetos ou roupas de cama. Tudo o que incluir trabalho mais pesado é considerado no item Todos os trabalhos de casa mais pesados incluindo mudar camas, lavar o chão, janelas, aspirar, mover cadeiras, etc. 6. Ter um papel substancial na organização e compra de mercearia quer seja quantidades pequenas ou grandes. Deve ir até à loja realizar as compras e não apenas empurrar um carrinho de supermercado. Pode incluir levantamento da pensão ou ida aos correios. 7. Participar em encontros de associações, em atividades da igreja, ir ao cinema, ao teatro, tomar uma bebida/ir ao café, jantar fora com amigos, etc. Pode ser transportado para o local, desde que depois de chegar tenha um papel ativo. Inclui receber pessoas em casa, por convite do paciente, por exemplo, visitas de familiares ou amigos cujo propósito da visita não seja prestar cuidados. 8. Caminhar continuamente pelo menos 15 minutos (são permitidas pequenas pausas para recuperar o folego). Cerca de 1500 metros. Pode incluir caminhar enquanto faz compras desde que as caminhadas sejam longas o suficiente. 9. Requer alguma participação ativa e organização mental, por exemplo, plantar/semear ou cuidar de plantas de casa, fazer malha, pintar, jogar, fazer desporto (não apenas ver desporto na televisão). Podem ser atividades mentais como ler revistas temáticas, gerir investimentos na bolsa, ou ver montras. 10. Deve conduzir o carro (não ser apenas o passageiro), ou apanhar o autocarro/camioneta e viajar nele de forma independente. 11. Viagens de autocarro, comboio ou carro em lazer. Não incluir os eventos sociais habituais (por exemplo ir às compras ou ir ter com amigos que vivam perto). Deve envolver alguma organização e tomada de decisão por parte do paciente. Exclui viagens organizadas por instituições a não ser que o paciente possa optar por ir ou não. O aspeto principal é que viaje em lazer. Férias nos últimos 6 meses são divididas em dias por mês, por exemplo, 7 dias de férias corresponde a 1 a 2 dias por mês. 12. Jardinagem/Cuidar do quintal/horta: a. Tarefas leves: arranca ervas daninhas ou varre os carreiros. b. Tarefas moderadas: arranca ervas daninhas, passa o ancinho ou faz a poda, etc., regularmente. c. Tarefas Pesadas/Sempre que necessário: todo o tipo de trabalho necessário, incluindo cavar a terra. Frenchay Activities Index (FAI) Versão Portuguesa 1, University of Aveiro, Aveiro, Portugal. Frenchay Activities Index (FAI), Derick Wade, Oxford University Hospitals, Oxford Centre for Enablement (OCE), Oxford, UK.
185 Reparações/manutenção da casa/carro: d. Tarefas leves: faz pequenas reparações, substitui lâmpadas ou fichas. e. Tarefas moderadas: faz a limpeza geral anual, pendura um quadro, faz a manutenção simples do carro. f. Tarefas pesadas/sempre que necessário: Pinta/decora, faz a maior parte das reparações e da manutenção da casa/carro. 13. Leitura completa de livros, não inclui revistas ou jornais. Podem ser áudio-livros. 14. Trabalho para o qual o paciente é pago, não inclui voluntariado. Deve ser calculado o tempo médio de trabalho ao longo de 6 meses. Tomando o período de 6 meses como referência, pode calcular-se o trabalho de 18h/semana durante um mês, o que perfaz 3h/semana. Deve pontuar-se este exemplo como até 10 horas por semana. Frenchay Activities Index (FAI) Versão Portuguesa 1, University of Aveiro, Aveiro, Portugal. Frenchay Activities Index (FAI), Derick Wade, Oxford University Hospitals, Oxford Centre for Enablement (OCE), Oxford, UK.
186
187 Appendixes Appendix H: Barthel Index (BI) Brígida Patrício 187
188
189 Código de participante: PCA- (A preencher pelo investigador) BARTHEL INDEX (BI) VERSÃO PORTUGUESA Com ajuda Independente 1. Alimentação (se precisar de cortar os alimentos = ajuda) Move-se da cadeira de rodas para a cama e o inverso (inclui sentar-se na cama) Cuidados pessoais (lavar o rosto, pentear-se, barbear-se, escovar os dentes) Senta-se e levanta-se da sanita (manuseia as roupas, limpa-se, lava-se, puxa o autoclismo) Toma banho sozinho Caminha em terreno plano (ou se não for capaz de caminhar, é capaz de impulsionar a cadeira de rodas) *pontuar apenas se não for capaz de caminhar 10 0* 15 5* 7. Sobe e desce escadas Veste-se e despe-se (inclui atar atacadores e usar botões/fechos) Continência intestinal Continência urinária 5 10 Um paciente que pontue 100 é continente, alimenta-se sozinho, veste-se sozinho, levanta-se da cama e das cadeiras, toma banho sozinho, caminha pelo menos 200 metros e consegue subir e descer escadas. Isto não significa que seja capaz de viver sozinho: pode não ser capaz de cozinhar, Copyright Information Barthel Index MedChi, All Rights Reserved. The Maryland State Medical Society holds the copyright for the Barthel Index. It may be used freely for noncommercial purposes with the following citation: Mahoney FI, Barthel D. Functional evaluation: the Barthel Index. Maryland State Med Journal 1965;14: Used with permission. Permission is required to modify the Barthel Index or to use it for commercial purposes. Barthel Index - Portugal/European Portuguese- Mapi Institute. This version of the Barthel Index has been produced at the University of Aveiro in Portugal by: Luis M. T. Jesus, Alda Marques, Maria Teresa Roberto, Marlene Rosa and Brígida Patrício.
190 manter a casa e atender à porta, mas é capaz de ficar sozinho sem necessidade de prestação de cuidados. Definição e discussão da pontuação 1. Alimentação 10 = Independente. O paciente consegue comer uma refeição numa bandeja ou mesa quando alguém a coloca ao seu alcance. Ele pode usar um dispositivo auxiliar, se necessário, para cortar a comida, usar sal e pimenta, espalhar manteiga, etc. Isto deve ser realizado num tempo razoável. 5 = Alguma ajuda é necessária (para cortar a comida, etc, tal como enumerado anteriormente). 2. Move-se da cadeira de rodas para a cama e o inverso 15 = Independente em todas as fases desta atividade. O paciente consegue com segurança aproximar-se da cama na sua cadeira de rodas, bloquear os travões, levantar os apoios, mover-se com segurança para a cama, deitar-se, assumir a posição de sentado lateralmente na cama, mudar a posição da cadeira de rodas, se necessário, para fazer a transferência de volta em segurança. 10 = Se for necessária uma ajuda mínima em alguma parte desta atividade ou se o paciente precisar de ser lembrado ou supervisionado, por questões de segurança, numa ou mais partes desta atividade. 5 = O paciente consegue assumir a posição de sentado sem ajuda de uma segunda pessoa mas precisa de ser levantado da cama, ou a transferência é realizada com muita ajuda. Cuidados pessoais 5 = O paciente consegue lavar as mãos e rosto, pentear o cabelo, lavar os dentes, e barbearse. Ele pode usar qualquer tipo de lâmina, mas deve colocar a lâmina ou ligar a máquina de barbear sem ajuda, assim como retirá-la da gaveta ou armário. As pacientes devem ser capazes de se maquilhar, se for habitual, mas não precisam de fazer tranças ou penteados. 3. Senta-se e levanta-se da sanita 10 = O paciente é capaz de sentar-se e levantar-se da sanita, apertar e desapertar a roupa, evitar sujar as roupas, e usa o papel higiénico sem ajuda. Ele pode usar uma barra de apoio na parede ou outro objeto estável para suporte, se necessário. Se for necessário o uso de Copyright Information Barthel Index MedChi, All Rights Reserved. The Maryland State Medical Society holds the copyright for the Barthel Index. It may be used freely for noncommercial purposes with the following citation: Mahoney FI, Barthel D. Functional evaluation: the Barthel Index. Maryland State Med Journal 1965;14: Used with permission. Permission is required to modify the Barthel Index or to use it for commercial purposes. Barthel Index - Portugal/European Portuguese- Mapi Institute. This version of the Barthel Index has been produced at the University of Aveiro in Portugal by: Luis M. T. Jesus, Alda Marques, Maria Teresa Roberto, Marlene Rosa and Brígida Patrício.
191 uma arrastadeira em vez da sanita, ele deve ser capaz de a posicionar na cadeira, esvaziála, e limpá-la. 5 = O paciente precisa de ajuda devido à perda de equilíbrio ou no manuseio das roupas ou no uso de papel higiénico. 4. Toma banho sozinho 5 = O paciente pode usar uma banheira, um chuveiro ou tomar um banho completo com esponja. Ele deve ser capaz de realizar todos os passos envolvidos em qualquer um dos métodos aplicados sem nenhuma outra pessoa estar presente. 5. Caminha em terreno plano 15 = O paciente consegue andar pelo menos 45 metros sem ajuda ou supervisão. Ele pode usar ortóteses ou próteses, assim como muletas, bengalas ou andarilho mas não um andarilho com rodas. Ele deve ser capaz de bloquear e desbloquear ortóteses, se usar, colocar-se de pé e sentar-se, alcançar e posicionar as ajudas técnicas necessárias para o seu uso e colocá-las de lado quando se senta (colocar ou tirar as ortóteses é quantificado no item 8. Veste-se e despe-se). 10 = O paciente precisa de ajuda ou supervisão em qualquer das atividades descritas no ponto anterior mas consegue andar pelo menos 45 metros com uma pequena ajuda. 6.a. Impulsiona a cadeira de rodas 5 = Se um paciente não pode caminhar mas pode impulsionar uma cadeira de rodas independentemente. Ele deve ser capaz de contornar esquinas, virar, manobrar a cadeira até uma mesa, cama, sanita, etc. Deve ser capaz de impulsionar uma cadeira pelo menos 45 metros. Não pontue este item se o paciente foi pontuado no item 6. Caminha em terreno plano. 6. Sobe e desce escadas 10 = O paciente é capaz de subir e descer um lance de escadas em segurança sem ajuda ou supervisão. Pode e deve usar corrimões, bengalas, canadianas ou muletas se necessário. Deve ser capaz de segurar nas bengalas, canadianas ou muletas enquanto sobe ou desce as escadas. 5 = O paciente precisa da ajuda ou supervisão de alguém nas atividades referidas no ponto anterior. Copyright Information Barthel Index MedChi, All Rights Reserved. The Maryland State Medical Society holds the copyright for the Barthel Index. It may be used freely for noncommercial purposes with the following citation: Mahoney FI, Barthel D. Functional evaluation: the Barthel Index. Maryland State Med Journal 1965;14: Used with permission. Permission is required to modify the Barthel Index or to use it for commercial purposes. Barthel Index - Portugal/European Portuguese- Mapi Institute. This version of the Barthel Index has been produced at the University of Aveiro in Portugal by: Luis M. T. Jesus, Alda Marques, Maria Teresa Roberto, Marlene Rosa and Brígida Patrício.
192 7. Veste-se e despe-se 10 = O paciente deve ser capaz de vestir, despir e apertar toda a roupa e atar os atacadores dos sapatos (a menos que seja necessário usar adaptações para isso). A atividade inclui colocar e remover e apertar ortóteses quando estas são prescritas. Roupas especiais como suspensórios, sapatos sem atacadores, vestidos que abrem à frente, podem ser usados se necessário. 5 = O paciente precisa de ajuda para vestir, despir ou apertar/desapertar qualquer peça de roupa. Deve fazer pelo menos metade da tarefa sozinho. Deve concluir a tarefa num tempo razoável. As mulheres não precisam de ser pontuadas na utilização de soutien ou cinta, a não ser que se trate de peças de roupa prescritas. 8. Continência intestinal 10 = O paciente é capaz de controlar os intestinos e não ocorrem acidentes. Pode aplicar supositório ou um clister quando necessário (como no caso dos pacientes com lesão vertebro-medular com controlo intestinal). 5 = O paciente precisa de ajuda na aplicação de supositório ou clister ou ocorrem acidentes ocasionais. 9. Continência urinária 10 = O paciente é capaz de controlar a sua bexiga de dia e de noite. Pacientes com lesão vertebro-medular que usam um dispositivo externo (por exemplo, um dispositivo urinário) e um saco coletor devem manuseá-los independentemente, limpá-los e esvaziar o saco, e manter-se seco de dia e de noite. 5 = O paciente tem acidentes ocasionais ou não aguenta esperar pela arrastadeira, não consegue chegar a tempo à casa de banho ou precisa de ajuda com o dispositivo externo. A pontuação 0 é atribuída a todas as atividades referidas anteriormente quando o paciente não consegue preencher os critérios definidos anteriormente. Copyright Information Barthel Index MedChi, All Rights Reserved. The Maryland State Medical Society holds the copyright for the Barthel Index. It may be used freely for noncommercial purposes with the following citation: Mahoney FI, Barthel D. Functional evaluation: the Barthel Index. Maryland State Med Journal 1965;14: Used with permission. Permission is required to modify the Barthel Index or to use it for commercial purposes. Barthel Index - Portugal/European Portuguese- Mapi Institute. This version of the Barthel Index has been produced at the University of Aveiro in Portugal by: Luis M. T. Jesus, Alda Marques, Maria Teresa Roberto, Marlene Rosa and Brígida Patrício.
193 Appendixes Appendix I: Mini-mental State Modificado (MMSM) Brígida Patrício 193
194
195 Código de participante: PCA- (A preencher pelo investigador) Mini-Mental State Modificado (MMSM) Versão 1, Universidade de Aveiro, Portugal MINI MENTAL STATE MODIFICADO (MMSM) 1. ORIENTAÇÃO Vou fazer-lhe algumas perguntas. A maior parte delas são fáceis. Tente responder o melhor que for capaz (dar 1 ponto por cada resposta correcta). a. Em que ano estamos? b. Em que mês estamos? c. Em que dia do mês estamos? d. Em que estação do ano estamos? e. Em que dia da semana estamos? f. Em que país estamos? g. Em que distrito vive? h. Em que terra vive? i. Em que casa estamos? (Como se chama esta casa onde estamos?) j. Em que andar estamos? Total a. Em que ano estamos? Aponte na folha para a palavra ano e para as 6 opções escritas apresentadas. b. Em que mês estamos? Aponte para as 6 opções de palavras apresentadas nas quais se encontra a palavra alvo. c. Sabe em que dia do mês estamos? É Diga ao paciente qual o mês em que estamos, mostre-lhe o mês escrito nas folhas anteriores (se necessário). Sabe a data de hoje? O mês correto e possíveis datas são apresentados (escreva 6 opções de dias numa folha à parte, sem pistas quanto ao dia da semana). d. Em que estação do ano estamos? Aponte para as 4 opções de palavras ou de imagens/palavras. e. Em que dia da semana estamos? Mostre as opções possíveis na folha disponibilizada. f. Em que país estamos? Aponte para cada um dos 6 nomes de países. g. Em que distrito vive? Apresente/escreva, numa folha à parte, 6 opções possíveis entre as quais se encontra o distrito onde a pessoa vive. h. Em que terra vive? Apresente/escreva, numa folha à parte, 6 opções possíveis entre as quais se encontra a terra onde vive. i. Em que casa estamos? Que edifício é este? Apresente/escreva, numa folha à parte, 6 opções possíveis entre as quais se encontra o nome do local onde estão. j. Em que andar estamos? Apresente/escreva, numa folha à parte, 6 opções possíveis entre as quais se encontra o andar onde estão. k. RETENÇÃO DE IMAGENS Olhe para estas imagens e procure lembrar-se delas. Aponte para a palavra LEMBRAR e depois para cada imagem durante 3 segundos. Remova as imagens Quais as imagens que acabou de ver? Mostre o conjunto de imagens A (3 imagens anteriores + 15 imagens diferentes). a. Pêra (1) b. Gato (1) c. Bola (1) Se o paciente omitir um dos itens apresentados, mostre novamente as primeiras 3 imagens, num total de 2 vezes. Caso o indivíduo não consiga, dê continuidade à prova. Mini-Mental State Examination, Psychological Assessment Resources (PAR), USA. Mini-Mental State Examination Validado para a População Portuguesa, Universidade de Lisboa, Portugal. The Language Modified Mini-Mental State, University of South Florida, USA.

196 Mini-Mental State Modificado (MMSM) Versão 1, Universidade de Aveiro, Portugal l. ATENÇÃO Apresente o calendário com os meses do ano e o quadro de sequência com os números. Com o quadro de sequência na frente do indivíduo, diga Ponha os meses por ordem, começando de trás para a frente. Inicie com Dezembro e ponha os meses por ordem andando para trás no ano (aponte para os quadrados numerados indicando a ordem que se pretende que siga). Pode ser dada a pista inicial Qual o mês que vem antes de Dezembro?. Entregue os cartões com os meses (os meses devem ser colocados na posição correta para que a pontuação seja atribuída). a. Novembro (1) c. Setembro (1) e. Julho (1) b. Outubro (1) d. Agosto (1) m. EVOCAÇÃO Quais as três imagens que lhe pedi há pouco para se lembrar? Mostre novamente as 18 opções. a. Pêra (1) b. Gato (1) c. Bola (1) n. LINGUAGEM (1 ponto por cada resposta correcta) a. Mostrar o relógio de pulso durante 10 segundos. Como se chama isto? b. Mostrar o lápis durante 10 segundos. Como se chama isto? c. Repetir a frase. O rato rói a rolha (Todas as palavras devem estar na ordem certa. Caso existam erros morfológicos, considere a resposta correta). d. Vou dar-lhe uma folha de papel. Quando eu lha entregar, pegue nela com a sua mão direita, dobre-a ao meio e coloque-a no chão. Se o paciente apresentar défices motores, coloque três folhas coloridas em cima da mesa (uma vermelha, uma amarela e uma verde) e substitua o a frase por: Pegue na folha vermelha, dobre-a ao meio e ponha-a no chão. (Se for necessário use a prancha com a frase escrita) Pega no papel com a mão direita/folha de papel vermelho (1) Dobra a folha ao meio (1) Coloca-a no chão (1) e. Leia e faça o que diz neste cartão. (Mostrar o cartão com a frase Feche os olhos. Se o sujeito for analfabeto o examinador deverá ler-lhe a frase. Cumpre (1) f. Escreva uma frase. (Forneça uma folha e um lápis ou caneta para que o indivíduo possa escrever). A frase deverá ter sujeito, verbo e ter sentido para ser pontuada com um ponto. Erros gramaticais ou troca de letras não contam como erros. Se o sujeito for analfabeto não se realiza este item. Frase (1) g. Copie o desenho que lhe vou mostrar. Aponte para a imagem dos pentágonos em intersecção, para a palavra Copiar e para uma folha com espaço em branco para a cópia (os 10 ângulos devem estar presentes e 2 deles devem estar intersectados para pontuar 1 ponto. Tremor e erros de rotação não são valorizados). TOTAL (Máximo de 30 pontos) Mini-Mental State Examination, Psychological Assessment Resources (PAR), USA. Mini-Mental State Examination Validado para a População Portuguesa, Universidade de Lisboa, Portugal. The Language Modified Mini-Mental State, University of South Florida, USA.
Secção Autónoma de Ciências da Saúde Universidade de Aveiro. Programa Doutoral em Ciências e Tecnologias da Saúde. Provas Públicas
 Secção Autónoma de Ciências da Saúde Universidade de Aveiro Programa Doutoral em Ciências e Tecnologias da Saúde Provas Públicas Impacto das alterações da comunicação na qualidade de vida das pessoas com
Service quality in restaurants: an experimental analysis performed in Brazil
 . XIII INTERNATIONAL CONFERENCE ON INDUSTRIAL ENGINEERING AND OPERATIONS MANAGEMENT Energy that moves production: a dialogue among integration, project and sustainability 09-11 October 2007 Service quality
Afasia na vida das PCA
 Viver com afasia Implicações na qualidade de vida Autores: Luís Jesus, University of Aveiro Madeline Cruice, City University London Palestrante: Terapeuta da Fala Docente na Escola Superior de Tecnologia
Colaborar: Missão impossível? Lições da área da saúde mental. José Miguel Caldas de Almeida 17 de Janeiro de 2017
 Colaborar: Missão impossível? Lições da área da saúde mental José Miguel Caldas de Almeida 17 de Janeiro de 2017 Mental disorders require new models of collaborative care Collaborative care model is the
Vaporpunk - A fazenda-relógio (Portuguese Edition)
") Vaporpunk - A fazenda-relógio (Portuguese Edition) Octavio Aragão Click here if your download doesn"t start automatically Vaporpunk - A fazenda-relógio (Portuguese Edition) Octavio Aragão Vaporpunk - A
Vaporpunk - A fazenda-relógio (Portuguese Edition) Octavio Aragão Click here if your download doesn"t start automatically Vaporpunk - A fazenda-relógio (Portuguese Edition) Octavio Aragão Vaporpunk - A
MASTER S DEGREE IN INTELLECTUAL PROPERTY ADMISSION EXAM
 CADERNO DE QUESTÕES NOTA FINAL MASTER S DEGREE IN INTELLECTUAL PROPERTY ADMISSION EXAM Before reading the text, pay attention to these important and essential remarks. All the answers must be written in
Vendors Enquiries for RFP 003/2015
 Date: 22/10/2015 Vendors Enquiries for RFP 003/2015 1) Question I am afraid the terms of the RFP cannot be complied by none of the companies we work with, the terms have limited the underwriters ability
Inflation Expectations and Behavior: Do Survey Respondents Act on their Beliefs? O. Armantier, W. Bruine de Bruin, G. Topa W. VanderKlaauw, B.
 Inflation Expectations and Behavior: Do Survey Respondents Act on their Beliefs? O. Armantier, W. Bruine de Bruin, G. Topa W. VanderKlaauw, B. Zafar November 18, 2010 Introduction Inflation expectations
Iniciação à Administração Geral (Portuguese Edition)
") Iniciação à Administração Geral (Portuguese Edition) Idalberto Chiavenato Click here if your download doesn"t start automatically Iniciação à Administração Geral (Portuguese Edition) Idalberto Chiavenato
Iniciação à Administração Geral (Portuguese Edition) Idalberto Chiavenato Click here if your download doesn"t start automatically Iniciação à Administração Geral (Portuguese Edition) Idalberto Chiavenato
Lucas de Assis Soares, Luisa Nunes Ramaldes, Taciana Toledo de Almeida Albuquerque, Neyval Costa Reis Junior. São Paulo, 2013
 COMPARATIVE STUDY OF THE ATMOSPHERIC DISPERSION MODELS AND THROUGH THE ANALYSIS OF AIR QUALITY IN THE METROPOLITAN REGION OF GRANDE VITÓRIA Lucas de Assis Soares, Luisa Nunes Ramaldes, Taciana Toledo de
Escola Superior de Altos Estudos
 Escola Superior de Altos Estudos Defeito cognitivo, sintomas de depressão e satisfação com a vida em idosos sob resposta social do concelho de Coimbra INÊS TORRES PENA Dissertação Apresentada ao ISMT para
Certificação PMP: Alinhado com o PMBOK Guide 5ª edição (Portuguese Edition)
") Certificação PMP: Alinhado com o PMBOK Guide 5ª edição (Portuguese Edition) Armando Monteiro Click here if your download doesn"t start automatically Certificação PMP: Alinhado com o PMBOK Guide 5ª edição
Certificação PMP: Alinhado com o PMBOK Guide 5ª edição (Portuguese Edition) Armando Monteiro Click here if your download doesn"t start automatically Certificação PMP: Alinhado com o PMBOK Guide 5ª edição
Meditacao da Luz: O Caminho da Simplicidade
 Meditacao da Luz: O Caminho da Simplicidade Leonardo Boff Click here if your download doesn"t start automatically Meditacao da Luz: O Caminho da Simplicidade Leonardo Boff Meditacao da Luz: O Caminho da
Princípios de Direito Previdenciário (Portuguese Edition)
") Princípios de Direito Previdenciário (Portuguese Edition) Wladimir Novaes. Martinez Click here if your download doesn"t start automatically Princípios de Direito Previdenciário (Portuguese Edition) Wladimir
Princípios de Direito Previdenciário (Portuguese Edition) Wladimir Novaes. Martinez Click here if your download doesn"t start automatically Princípios de Direito Previdenciário (Portuguese Edition) Wladimir
Graduates employability: sharing some ideas. Diana Aguiar Vieira
 Graduates employability: sharing some ideas Diana Aguiar Vieira AlmaLaurea Conference, 2018 18.500 Estudantes 2.000 Trabalhadores 100.000 Alumni 8 Escolas / 3 Pólos ISEP ISCAP ESE ESMAE ESS ESTG ESHT ESMAD
A dança do corpo vestido: Um estudo do desenvolvimento do figurino de balé clássico até o século XIX (Portuguese Edition)
") A dança do corpo vestido: Um estudo do desenvolvimento do figurino de balé clássico até o século XIX (Portuguese Edition) Francisca Dantas Mendes Click here if your download doesn"t start automatically
A dança do corpo vestido: Um estudo do desenvolvimento do figurino de balé clássico até o século XIX (Portuguese Edition) Francisca Dantas Mendes Click here if your download doesn"t start automatically
Astrologia, Psicologia e os Quatro Elementos (Portuguese Edition)
") Astrologia, Psicologia e os Quatro Elementos (Portuguese Edition) Click here if your download doesn"t start automatically Astrologia, Psicologia e os Quatro Elementos (Portuguese Edition) Astrologia, Psicologia
Astrologia, Psicologia e os Quatro Elementos (Portuguese Edition) Click here if your download doesn"t start automatically Astrologia, Psicologia e os Quatro Elementos (Portuguese Edition) Astrologia, Psicologia
A necessidade da oração (Escola da Oração) (Portuguese Edition)
 (Portuguese Edition)") A necessidade da oração (Escola da Oração) (Portuguese Edition) Click here if your download doesn"t start automatically A necessidade da oração (Escola da Oração) (Portuguese Edition) A necessidade da
A necessidade da oração (Escola da Oração) (Portuguese Edition) Click here if your download doesn"t start automatically A necessidade da oração (Escola da Oração) (Portuguese Edition) A necessidade da
Biscuit - potes (Coleção Artesanato) (Portuguese Edition)
 (Portuguese Edition)") Biscuit - potes (Coleção Artesanato) (Portuguese Edition) Regina Panzoldo Click here if your download doesn"t start automatically Biscuit - potes (Coleção Artesanato) (Portuguese Edition) Regina Panzoldo
Biscuit - potes (Coleção Artesanato) (Portuguese Edition) Regina Panzoldo Click here if your download doesn"t start automatically Biscuit - potes (Coleção Artesanato) (Portuguese Edition) Regina Panzoldo
A Avaliação dos Projetos
 A Avaliação dos Projetos Luis M. Correia 1 Instituto Superior Técnico / INOV-INESC Universidade de Lisboa, Portugal As Perguntas Como são avaliadas as propostas? Quem avalia as propostas? Quais os critérios
Apêndice 1 Pedido de autorização das escalas que englobaram o protocolo. Pedido de autorização da Cognitive Test Anxiety Scale CTAR25
 APÊNDICES Apêndice 1 Pedido de autorização das escalas que englobaram o protocolo Pedido de autorização da Cognitive Test Anxiety Scale CTAR25 Dear Professor Jerrell C. Cassady, I am a student of Miguel
DESENVOLVIMENTO MORAL NAS ORGANIZAÇÕES: UM ESTUDO NA ASSOCIAÇÃO DE ALCOÓLICOS ANÔNIMOS
 UNIVERSIDADE DO ESTADO DE SANTA CATARINA UDESC CENTRO DE CIÊNCIAS DA ADMINISTRAÇÃO E SOCIOECÔNOMICAS ESAG - CURSO DE MESTRADO ACADÊMICO EM ADMINISTRAÇÃO DISSERTAÇÃO DE MESTRADO DESENVOLVIMENTO MORAL NAS
ESCOLA NAVAL DEPARTAMENTO DE MARINHA
 ESCOLA NAVAL DEPARTAMENTO DE MARINHA CIÊNCIA E TÉCNICA NOS ANAIS DO CLUBE MILITAR NAVAL DA FUNDAÇÃO ATÉ 1879 ASPOF Rui Miguel David Coronha MESTRADO EM CIÊNCIAS MILITARES NAVAIS (MARINHA) 2013 ESCOLA NAVAL
UNIVERSIDADE DO SAGRADO CORAÇÃO MILENA CAROLINA SILVA CASTRO OLIVEIRA
 UNIVERSIDADE DO SAGRADO CORAÇÃO MILENA CAROLINA SILVA CASTRO OLIVEIRA QUALIDADE DE VIDA RELACIONADA À SAÚDE E SUA ASSOCIAÇÃO COM EXCESSO DE PESO DE ESCOLARES BAURU 2016 MILENA CAROLINA SILVA CASTRO OLIVEIRA
Diogo Manuel dos Santos Branco. A Contabilidade de Gestão no Ensino Superior em Portugal
 Universidade de Aveiro Instituto Superior de Contabilidade e Administração 2014 de Aveiro Diogo Manuel dos Santos Branco A Contabilidade de Gestão no Ensino Superior em Portugal Universidade de Aveiro
Rádio Escolar: uma experiência de letramento midiático (Coleção Trabalhando com... na escola Livro 4) (Portuguese Edition)
 (Portuguese Edition)") Rádio Escolar: uma experiência de letramento midiático (Coleção Trabalhando com... na escola Livro 4) (Portuguese Edition) Marcos Baltar Click here if your download doesn"t start automatically Rádio Escolar:
Rádio Escolar: uma experiência de letramento midiático (Coleção Trabalhando com... na escola Livro 4) (Portuguese Edition) Marcos Baltar Click here if your download doesn"t start automatically Rádio Escolar:
O sistema único de assistência social no Brasil: uma realidade em movimento (Portuguese Edition)
") O sistema único de assistência social no Brasil: uma realidade em movimento (Portuguese Edition) Click here if your download doesn"t start automatically O sistema único de assistência social no Brasil:
O sistema único de assistência social no Brasil: uma realidade em movimento (Portuguese Edition) Click here if your download doesn"t start automatically O sistema único de assistência social no Brasil:
Idosos Ativos, Idosos Saudáveis
 INSTITUTO POLITÉCNICO DE LISBOA ESCOLA SUPERIOR DE TECNOLOGIA DA SAÚDE DE LISBOA Idosos Ativos, Idosos Saudáveis nº693206/10 Orientador: Profª. Doutora Luísa Pedro Prof.ª Adjunta da Escola Superior de
UNIVERSIDADE CATÓLICA PORTUGUESA. Dissertação apresentada à Universidade Católica Portuguesa para obtenção do grau de Mestre em Ensino de Música
 UNIVERSIDADE CATÓLICA PORTUGUESA O ARCO CONTRIBUTOS DIDÁTICOS AO ENSINO DO VIOLINO Dissertação apresentada à Universidade Católica Portuguesa para obtenção do grau de Mestre em Ensino de Música Ana Catarina
Palavras chave: trabalho colaborativo, desenvolvimento profissional, articulação curricular, tarefas de investigação e exploração.
 RESUMO Esta investigação, tem como objectivo perceber como é que o trabalho colaborativo pode ajudar a melhorar as práticas lectivas dos professores, favorecendo a articulação curricular entre ciclos na
Pesquisa Qualitativa do Início ao Fim (Métodos de Pesquisa) (Portuguese Edition)
 (Portuguese Edition)") Pesquisa Qualitativa do Início ao Fim (Métodos de Pesquisa) (Portuguese Edition) Robert K. Yin Click here if your download doesn"t start automatically Pesquisa Qualitativa do Início ao Fim (Métodos de
Pesquisa Qualitativa do Início ao Fim (Métodos de Pesquisa) (Portuguese Edition) Robert K. Yin Click here if your download doesn"t start automatically Pesquisa Qualitativa do Início ao Fim (Métodos de
Como Falar no Rádio - Prática de Locução Am e Fm (Portuguese Edition)
") Como Falar no Rádio - Prática de Locução Am e Fm (Portuguese Edition) Cyro César Click here if your download doesn"t start automatically Como Falar no Rádio - Prática de Locução Am e Fm (Portuguese Edition)
Como Falar no Rádio - Prática de Locução Am e Fm (Portuguese Edition) Cyro César Click here if your download doesn"t start automatically Como Falar no Rádio - Prática de Locução Am e Fm (Portuguese Edition)
Um olhar que cura: Terapia das doenças espirituais (Portuguese Edition)
") Um olhar que cura: Terapia das doenças espirituais (Portuguese Edition) Padre Paulo Ricardo Click here if your download doesn"t start automatically Um olhar que cura: Terapia das doenças espirituais (Portuguese
Um olhar que cura: Terapia das doenças espirituais (Portuguese Edition) Padre Paulo Ricardo Click here if your download doesn"t start automatically Um olhar que cura: Terapia das doenças espirituais (Portuguese
Gestão da comunicação - Epistemologia e pesquisa teórica (Portuguese Edition)
") Gestão da comunicação - Epistemologia e pesquisa teórica (Portuguese Edition) Maria Cristina Castilho Costa, Maria Aparecida Baccega Click here if your download doesn"t start automatically Download and
Gestão da comunicação - Epistemologia e pesquisa teórica (Portuguese Edition) Maria Cristina Castilho Costa, Maria Aparecida Baccega Click here if your download doesn"t start automatically Download and
Dinâmicas de leitura para sala de aula (Portuguese Edition)
") Dinâmicas de leitura para sala de aula (Portuguese Edition) Mary Rangel Click here if your download doesn"t start automatically Dinâmicas de leitura para sala de aula (Portuguese Edition) Mary Rangel Dinâmicas
Dinâmicas de leitura para sala de aula (Portuguese Edition) Mary Rangel Click here if your download doesn"t start automatically Dinâmicas de leitura para sala de aula (Portuguese Edition) Mary Rangel Dinâmicas
Poder sem limites - o caminho do sucesso pessoal pela programação neurolinguística
 Poder sem limites - o caminho do sucesso pessoal pela programação neurolinguística Anthony Robbins Click here if your download doesn"t start automatically Poder sem limites - o caminho do sucesso pessoal
Potencial da Telemedicina Dentária no diagnóstico oral infantil
 Potencial da Telemedicina Dentária no diagnóstico oral infantil ( RESUMO / ABSTRACT) Rui José de Oliveira Amável Morais 2010 Mestrado de Informática Médica Faculdade de Ciências Faculdade de Medicina Universidade
NÚCLEO DE TECNOLOGIA EDUCACIONAL PARA A SAÚDE UNIVERSIDADE FEDERAL DO RIO DE JANEIRO
 NÚCLEO DE TECNOLOGIA EDUCACIONAL PARA A SAÚDE UNIVERSIDADE FEDERAL DO RIO DE JANEIRO PROVA DE SELEÇÃO AO CURSO DE DOUTORADO EDUCAÇÃO EM CIÊNCIAS E SAÚDE PROVA DE INGLÊS O objetivo desta prova é avaliar
Erasmus Student Work Placement
 Erasmus Student Work Placement EMPLOYER INFORMATION Name of organisation Address Post code Country SPORT LISBOA E BENFICA AV. GENERAL NORTON DE MATOS, 1500-313 LISBOA PORTUGAL Telephone 21 721 95 09 Fax
Teste do Tempo & Troco
 Instituto Superior Miguel Torga Escola Superior de Altos Estudos Teste do Tempo & Troco Estudo de Validação Edgar Correia Dissertação de Mestrado em Psicologia Clínica Coimbra, 2011 Teste do Tempo & Troco
Revisão Sistemática: Conceitos Básicos
 SSC5905 Revisão Sistemática em Engenharia de Software Revisão Sistemática: Conceitos Básicos Profa. Dra. Elisa Yumi Nakagawa elisa@icmc.usp.br ICMC/USP São Carlos 1. Semestre 2013 Questões preliminares
Resolução da Questão 1 (Texto Definitivo)
") Questão Sabendo que o desenvolvimento humano sofre influências de aspectos subpessoais (biológicos da espécie), aspectos intrapessoais (conscientes e inconscientes) e aspectos interpessoais (interações
Questão Sabendo que o desenvolvimento humano sofre influências de aspectos subpessoais (biológicos da espécie), aspectos intrapessoais (conscientes e inconscientes) e aspectos interpessoais (interações
PL/SQL: Domine a linguagem do banco de dados Oracle (Portuguese Edition)
") PL/SQL: Domine a linguagem do banco de dados Oracle (Portuguese Edition) Eduardo Gonçalves Click here if your download doesn"t start automatically PL/SQL: Domine a linguagem do banco de dados Oracle (Portuguese
PL/SQL: Domine a linguagem do banco de dados Oracle (Portuguese Edition) Eduardo Gonçalves Click here if your download doesn"t start automatically PL/SQL: Domine a linguagem do banco de dados Oracle (Portuguese
Poder sem limites - o caminho do sucesso pessoal pela programação neurolinguística
 Poder sem limites - o caminho do sucesso pessoal pela programação neurolinguística By Anthony Robbins Poder sem limites - o caminho do sucesso pessoal pela programação neurolinguística By Anthony Robbins
Mestrado em Ciências da Educação Administração Educacional. A Direção de Turma RELATÓRIO DE ATIVIDADE E DESENVOLVIMENTO PROFISSIONAL
 Mestrado em Ciências da Educação Administração Educacional A Direção de Turma RELATÓRIO DE ATIVIDADE E DESENVOLVIMENTO PROFISSIONAL Cristina Maria de Matos Pina Relatório destinado à obtenção do grau de
Pesquisa de Marketing: Uma Orientação Aplicada (Portuguese Edition)
") Pesquisa de Marketing: Uma Orientação Aplicada (Portuguese Edition) Naresh K. Malhotra Click here if your download doesn"t start automatically Pesquisa de Marketing: Uma Orientação Aplicada (Portuguese
Pesquisa de Marketing: Uma Orientação Aplicada (Portuguese Edition) Naresh K. Malhotra Click here if your download doesn"t start automatically Pesquisa de Marketing: Uma Orientação Aplicada (Portuguese
O PRíNCIPE FELIZ E OUTRAS HISTóRIAS (EDIçãO BILíNGUE) (PORTUGUESE EDITION) BY OSCAR WILDE
 (PORTUGUESE EDITION) BY OSCAR WILDE") Read Online and Download Ebook O PRíNCIPE FELIZ E OUTRAS HISTóRIAS (EDIçãO BILíNGUE) (PORTUGUESE EDITION) BY OSCAR WILDE DOWNLOAD EBOOK : O PRíNCIPE FELIZ E OUTRAS HISTóRIAS (EDIçãO Click link bellow and
Read Online and Download Ebook O PRíNCIPE FELIZ E OUTRAS HISTóRIAS (EDIçãO BILíNGUE) (PORTUGUESE EDITION) BY OSCAR WILDE DOWNLOAD EBOOK : O PRíNCIPE FELIZ E OUTRAS HISTóRIAS (EDIçãO Click link bellow and
Transformando Pessoas - Coaching, PNL e Simplicidade no processo de mudancas (Portuguese Edition)
") Transformando Pessoas - Coaching, PNL e Simplicidade no processo de mudancas (Portuguese Edition) Felippe / Marcelo Click here if your download doesn"t start automatically Transformando Pessoas - Coaching,
Transformando Pessoas - Coaching, PNL e Simplicidade no processo de mudancas (Portuguese Edition) Felippe / Marcelo Click here if your download doesn"t start automatically Transformando Pessoas - Coaching,
Farmacologia na Pratica de Enfermagem (Em Portuguese do Brasil)
") Farmacologia na Pratica de Enfermagem (Em Portuguese do Brasil) Click here if your download doesn"t start automatically Farmacologia na Pratica de Enfermagem (Em Portuguese do Brasil) Farmacologia na Pratica
Farmacologia na Pratica de Enfermagem (Em Portuguese do Brasil) Click here if your download doesn"t start automatically Farmacologia na Pratica de Enfermagem (Em Portuguese do Brasil) Farmacologia na Pratica
Receitas na Pressão - Vol. 01: 50 Receitas para Panela de Pressão Elétrica (Portuguese Edition)
") Receitas na Pressão - Vol. 01: 50 Receitas para Panela de Pressão Elétrica (Portuguese Edition) Click here if your download doesn"t start automatically Receitas na Pressão - Vol. 01: 50 Receitas para Panela
Receitas na Pressão - Vol. 01: 50 Receitas para Panela de Pressão Elétrica (Portuguese Edition) Click here if your download doesn"t start automatically Receitas na Pressão - Vol. 01: 50 Receitas para Panela
As 100 melhores piadas de todos os tempos (Portuguese Edition)
") As 100 melhores piadas de todos os tempos (Portuguese Edition) Click here if your download doesn"t start automatically As 100 melhores piadas de todos os tempos (Portuguese Edition) As 100 melhores piadas
As 100 melhores piadas de todos os tempos (Portuguese Edition) Click here if your download doesn"t start automatically As 100 melhores piadas de todos os tempos (Portuguese Edition) As 100 melhores piadas
Prova de Seleção Mestrado LINGUA INGLESA 15/02/2016
 Prova de Seleção Mestrado LINGUA INGLESA 15/02/2016 Instruções aos candidatos: (1) Preencher somente o número de inscrição em todas as folhas. (2) Usar caneta preta ou azul. 1 2 3 4 5 6 7 8 9 10 11 12
6 Só será permitido o uso de dicionário INGLÊS/INGLÊS.
 1 2 3 4 5 Confira se os dados contidos na parte inferior desta capa estão corretos e, em seguida, assine no espaço reservado para isso. Se, em qualquer outro local deste Caderno, você assinar, rubricar,
Comportamento Organizacional: O Comportamento Humano no Trabalho (Portuguese Edition)
") Comportamento Organizacional: O Comportamento Humano no Trabalho (Portuguese Edition) John W. Newstrom Click here if your download doesn"t start automatically Comportamento Organizacional: O Comportamento
Comportamento Organizacional: O Comportamento Humano no Trabalho (Portuguese Edition) John W. Newstrom Click here if your download doesn"t start automatically Comportamento Organizacional: O Comportamento
Introdução A Delphi Com Banco De Dados Firebird (Portuguese Edition)
") Introdução A Delphi Com Banco De Dados Firebird (Portuguese Edition) Ricardo De Moraes / André Luís De Souza Silva Click here if your download doesn"t start automatically Introdução A Delphi Com Banco
Introdução A Delphi Com Banco De Dados Firebird (Portuguese Edition) Ricardo De Moraes / André Luís De Souza Silva Click here if your download doesn"t start automatically Introdução A Delphi Com Banco
and environmental aspects aspectos socioambientais
 and environmental aspects 05social aspectos socioambientais 98 / 99 Número de Associados na Controladora Number of Associates in Parent Company 10.281 12.396 2 MIL 2006 2007 + novos empregos gerados na
Universidade da Beira Interior Faculdade de Ciências Sociais e Humanas Departamento de Psicologia e Educação
 Universidade da Beira Interior Faculdade de Ciências Sociais e Humanas Departamento de Psicologia e Educação DISSERTAÇÃO DE MESTRADO APRESENTADA À UNIVERSIDADE DA BEIRA INTERIOR COMO REQUISITO PARA A OBTENÇÃO
Como escrever para o Enem: roteiro para uma redação nota (Portuguese Edition)
") Como escrever para o Enem: roteiro para uma redação nota 1.000 (Portuguese Edition) Arlete Salvador Click here if your download doesn"t start automatically Como escrever para o Enem: roteiro para uma redação
Como escrever para o Enem: roteiro para uma redação nota 1.000 (Portuguese Edition) Arlete Salvador Click here if your download doesn"t start automatically Como escrever para o Enem: roteiro para uma redação
Guia para Formacao de Analistas de Processos: Gestão Por Processos de Forma Simples (Portuguese Edition)
") Guia para Formacao de Analistas de Processos: Gestão Por Processos de Forma Simples (Portuguese Edition) Mr. Gart Capote Click here if your download doesn"t start automatically Guia para Formacao de Analistas
Guia para Formacao de Analistas de Processos: Gestão Por Processos de Forma Simples (Portuguese Edition) Mr. Gart Capote Click here if your download doesn"t start automatically Guia para Formacao de Analistas
TITULO DA DISSERTAÇÃO: Respostas Emocionais (Ansiedade, Stress, e Depressão), Coping e Dor em Estudantes Universitários
, Coping e Dor em Estudantes Universitários") NOME: Isabel Cristina de Sousa Rotchild Barriga DEPARTAMENTO: Departamento de Psicologia ORIENTADOR: Prof. Dr. José Luís Pais Ribeiro DATA: 28 de Setembro de 2007 TITULO DA DISSERTAÇÃO: Respostas Emocionais
NOME: Isabel Cristina de Sousa Rotchild Barriga DEPARTAMENTO: Departamento de Psicologia ORIENTADOR: Prof. Dr. José Luís Pais Ribeiro DATA: 28 de Setembro de 2007 TITULO DA DISSERTAÇÃO: Respostas Emocionais
PL/SQL: Domine a linguagem do banco de dados Oracle (Portuguese Edition)
") PL/SQL: Domine a linguagem do banco de dados Oracle (Portuguese Edition) Eduardo Gonçalves Click here if your download doesn"t start automatically PL/SQL: Domine a linguagem do banco de dados Oracle (Portuguese
PL/SQL: Domine a linguagem do banco de dados Oracle (Portuguese Edition) Eduardo Gonçalves Click here if your download doesn"t start automatically PL/SQL: Domine a linguagem do banco de dados Oracle (Portuguese
Abraçado pelo Espírito (Portuguese Edition)
") Abraçado pelo Espírito (Portuguese Edition) Charles Swindoll Click here if your download doesn"t start automatically Abraçado pelo Espírito (Portuguese Edition) Charles Swindoll Abraçado pelo Espírito
Abraçado pelo Espírito (Portuguese Edition) Charles Swindoll Click here if your download doesn"t start automatically Abraçado pelo Espírito (Portuguese Edition) Charles Swindoll Abraçado pelo Espírito
ANABELA VIRGÍNIA DOS SANTOS FLORES DA ROCHA ESTIMAÇÃO ROBUSTA EM MODELOS LINEARES DE EQUAÇÕES SIMULTÂNEAS
 Universidade de Aveiro Departamento de Matemática 2010 ANABELA VIRGÍNIA DOS SANTOS FLORES DA ROCHA ESTIMAÇÃO ROBUSTA EM MODELOS LINEARES DE EQUAÇÕES SIMULTÂNEAS Universidade de Aveiro Departamento de Matemática
Medicina e Meditação - Um Médico Ensina a Meditar (Portuguese Edition)
") Medicina e Meditação - Um Médico Ensina a Meditar (Portuguese Edition) Medicina e Meditação - Um Médico Ensina a Meditar (Portuguese Edition) Médico há mais de vinte anos e meditador há mais tempo ainda,
Medicina e Meditação - Um Médico Ensina a Meditar (Portuguese Edition) Medicina e Meditação - Um Médico Ensina a Meditar (Portuguese Edition) Médico há mais de vinte anos e meditador há mais tempo ainda,
2ª AVALIAÇÃO/ º ANO / PRÉ-VESTIBULAR PROVA 1-25/04/2015 PROVA DISCURSIVA
 2ª AVALIAÇÃO/ 2015 3º ANO / PRÉ-VESTIBULAR PROVA 1-25/04/2015 PROVA DISCURSIVA ATENÇÃO! w Consulte a tabela abaixo para identificar a prova discursiva específica ao curso de sua opção. Curso com códigos
As 10 bobagens mais comuns que as pessoas inteligentes cometem (Portuguese Edition)
") As 10 bobagens mais comuns que as pessoas inteligentes cometem (Portuguese Edition) Arthur Freeman, Rose Dewolf Click here if your download doesn"t start automatically As 10 bobagens mais comuns que as
As 10 bobagens mais comuns que as pessoas inteligentes cometem (Portuguese Edition) Arthur Freeman, Rose Dewolf Click here if your download doesn"t start automatically As 10 bobagens mais comuns que as
Aprendi A Fazer Sexo Na Bíblia (Portuguese Edition)
") Aprendi A Fazer Sexo Na Bíblia (Portuguese Edition) Salomão Silva Click here if your download doesn"t start automatically Aprendi A Fazer Sexo Na Bíblia (Portuguese Edition) Salomão Silva Aprendi A Fazer
Aprendi A Fazer Sexo Na Bíblia (Portuguese Edition) Salomão Silva Click here if your download doesn"t start automatically Aprendi A Fazer Sexo Na Bíblia (Portuguese Edition) Salomão Silva Aprendi A Fazer
Writing Good Software Engineering Research Papers
 Writing Good Software Engineering Research Papers Mary Shaw Proceedings of the 25th International Conference on Software Engineering, IEEE Computer Society, 2003, pp. 726-736. Agenda Introdução Questões
O Livro dos Espíritos - Tradução Evandro Noleto Bezerra (Portuguese Edition)
") O Livro dos Espíritos - Tradução Evandro Noleto Bezerra (Portuguese Edition) Evandro Noleto Bezerra, Allan Kardec Click here if your download doesn"t start automatically O Livro dos Espíritos - Tradução
O Livro dos Espíritos - Tradução Evandro Noleto Bezerra (Portuguese Edition) Evandro Noleto Bezerra, Allan Kardec Click here if your download doesn"t start automatically O Livro dos Espíritos - Tradução
Já Chegou Aos Confins Da Terra. E Agora? (Portuguese Edition)
") Já Chegou Aos Confins Da Terra. E Agora? (Portuguese Edition) Click here if your download doesn"t start automatically Já Chegou Aos Confins Da Terra. E Agora? (Portuguese Edition) Já Chegou Aos Confins
Já Chegou Aos Confins Da Terra. E Agora? (Portuguese Edition) Click here if your download doesn"t start automatically Já Chegou Aos Confins Da Terra. E Agora? (Portuguese Edition) Já Chegou Aos Confins
Aspectos Multidisciplinares das Artes Marciais: 1 (Portuguese Edition)
") Aspectos Multidisciplinares das Artes Marciais: 1 (Portuguese Edition) Marcelo Moreira Antunes (org.) Click here if your download doesn"t start automatically Aspectos Multidisciplinares das Artes Marciais:
Aspectos Multidisciplinares das Artes Marciais: 1 (Portuguese Edition) Marcelo Moreira Antunes (org.) Click here if your download doesn"t start automatically Aspectos Multidisciplinares das Artes Marciais:
Conversação Para Viagem - Inglês (Michaelis Tour) (Portuguese Edition)
 (Portuguese Edition)") Conversação Para Viagem - Inglês (Michaelis Tour) (Portuguese Edition) Antonio Carlos Vilela Click here if your download doesn"t start automatically Conversação Para Viagem - Inglês (Michaelis Tour) (Portuguese
Conversação Para Viagem - Inglês (Michaelis Tour) (Portuguese Edition) Antonio Carlos Vilela Click here if your download doesn"t start automatically Conversação Para Viagem - Inglês (Michaelis Tour) (Portuguese
A Vivência do Evangelho Segundo o Espiritismo (Portuguese Edition)
") A Vivência do Evangelho Segundo o Espiritismo (Portuguese Edition) Edison de Oliveira Click here if your download doesn"t start automatically A Vivência do Evangelho Segundo o Espiritismo (Portuguese Edition)
A Vivência do Evangelho Segundo o Espiritismo (Portuguese Edition) Edison de Oliveira Click here if your download doesn"t start automatically A Vivência do Evangelho Segundo o Espiritismo (Portuguese Edition)
A Prática Reflexiva no Oficio de Professor. Profissionalização e Razão Pedagógica (Em Portuguese do Brasil)
") A Prática Reflexiva no Oficio de Professor. Profissionalização e Razão Pedagógica (Em Portuguese do Brasil) By Philippe Perrenoud A Prática Reflexiva no Oficio de Professor. Profissionalização e Razão
A Prática Reflexiva no Oficio de Professor. Profissionalização e Razão Pedagógica (Em Portuguese do Brasil) By Philippe Perrenoud A Prática Reflexiva no Oficio de Professor. Profissionalização e Razão
Faculdade de Medicina da Universidade do Porto
 Faculdade de Medicina da Universidade do Porto Introdução à Medicina 1.º ano 2005/2006 Home monitoring for heart failure Systematic review Which type of monitoring (home monitoring/ health care system
Antonio Moreira Franco Junior. Click here if your download doesn"t start automatically
 Ensino da Contabilidade Introdutória: Uma análise do ensino nos cursos de Ciências Contábeis das Instituições de Ensino Superior do Estado de São Paulo (Portuguese Edition) Antonio Moreira Franco Junior
Os 7 Hábitos das Pessoas Altamente Eficazes (Portuguese Edition)
") Os 7 Hábitos das Pessoas Altamente Eficazes (Portuguese Edition) Click here if your download doesn"t start automatically Os 7 Hábitos das Pessoas Altamente Eficazes (Portuguese Edition) Os 7 Hábitos das
Os 7 Hábitos das Pessoas Altamente Eficazes (Portuguese Edition) Click here if your download doesn"t start automatically Os 7 Hábitos das Pessoas Altamente Eficazes (Portuguese Edition) Os 7 Hábitos das
Conceitos de Linguagens de Programação (Portuguese Edition)
") Conceitos de Linguagens de Programação (Portuguese Edition) Click here if your download doesn"t start automatically Conceitos de Linguagens de Programação (Portuguese Edition) Conceitos de Linguagens de
Conceitos de Linguagens de Programação (Portuguese Edition) Click here if your download doesn"t start automatically Conceitos de Linguagens de Programação (Portuguese Edition) Conceitos de Linguagens de
Pesquisa de Marketing: Uma Orientação Aplicada (Portuguese Edition)
") Pesquisa de Marketing: Uma Orientação Aplicada (Portuguese Edition) By Naresh K. Malhotra Pesquisa de Marketing: Uma Orientação Aplicada (Portuguese Edition) By Naresh K. Malhotra Ilustra a interação entre
Pesquisa de Marketing: Uma Orientação Aplicada (Portuguese Edition) By Naresh K. Malhotra Pesquisa de Marketing: Uma Orientação Aplicada (Portuguese Edition) By Naresh K. Malhotra Ilustra a interação entre
MySQL: Comece com o principal banco de dados open source do mercado (Portuguese Edition)
") MySQL: Comece com o principal banco de dados open source do mercado (Portuguese Edition) Click here if your download doesn"t start automatically MySQL: Comece com o principal banco de dados open source
MySQL: Comece com o principal banco de dados open source do mercado (Portuguese Edition) Click here if your download doesn"t start automatically MySQL: Comece com o principal banco de dados open source
Relações públicas comunitárias (Portuguese Edition)
") Relações públicas comunitárias (Portuguese Edition) Margarida Maria Krohling Kunsch Click here if your download doesn"t start automatically Relações públicas comunitárias (Portuguese Edition) Margarida
Relações públicas comunitárias (Portuguese Edition) Margarida Maria Krohling Kunsch Click here if your download doesn"t start automatically Relações públicas comunitárias (Portuguese Edition) Margarida
Universidade de São Paulo
 Universidade de São Paulo Faculdade de Medicina de Ribeirão Preto Departamento de Medicina Social Maria Angélica de Figueiredo Campos PERCEPÇÃO E AVALIAÇÃO DOS ALUNOS DO CURSO DE MEDICINA DE UMA ESCOLA
Tool. Change Agent. (English and Brazilian Portuguese) 2012 Changefirst Limited
 2012 Changefirst Limited") Tool Change Agent (English and Brazilian Portuguese) 01 Changefirst Limited Change Agent Assessment The questions below are designed for you to review and reflect on your actions as a Change Agent during
Tool Change Agent (English and Brazilian Portuguese) 01 Changefirst Limited Change Agent Assessment The questions below are designed for you to review and reflect on your actions as a Change Agent during
Operação e Manutenção de Vias. Road operation and Maintenance. Semestre do plano de estudos 3
 Nome UC Operação e Manutenção de Vias CU Name Código UC 747 Curso MEC Semestre do plano de estudos 3 Área científica Engenharia Civil Duração Semestral Horas de trabalho 136 ECTS 5 Horas de contacto T
A Bíblia do Pregador - Almeida Revista e Atualizada: Com esboços para sermões e estudos bíblicos (Portuguese Edition)
") A Bíblia do Pregador - Almeida Revista e Atualizada: Com esboços para sermões e estudos bíblicos (Portuguese Edition) Sociedade Bíblica do Brasil, Editora Evangélica Esperança Click here if your download
A Bíblia do Pregador - Almeida Revista e Atualizada: Com esboços para sermões e estudos bíblicos (Portuguese Edition) Sociedade Bíblica do Brasil, Editora Evangélica Esperança Click here if your download
CARLA DANIELA CABRAL DIAS. A utilização das ferramentas informáticas de apoio à auditoria interna nas empresas portuguesas
 Universidade de Aveiro Instituto Superior de Contabilidade e Administração 2017 de Aveiro CARLA DANIELA CABRAL DIAS A utilização das ferramentas informáticas de apoio à auditoria interna nas empresas portuguesas
Fr A Lógica Da Resolução Das Questões Usando Apenas Multiplicação E Divisão (Portuguese Edition)
") Fr A Lógica Da Resolução Das Questões Usando Apenas Multiplicação E Divisão (Portuguese Edition) Click here if your download doesn"t start automatically Fr A Lógica Da Resolução Das Questões Usando Apenas
Fr A Lógica Da Resolução Das Questões Usando Apenas Multiplicação E Divisão (Portuguese Edition) Click here if your download doesn"t start automatically Fr A Lógica Da Resolução Das Questões Usando Apenas
HR Innovation Education Programs
 HR Innovation Education Programs 1 Objective of the Education Programs 4Ensure effective integration of new employees, aligned with organizational guidelines and technical best practices; 4 Develop a cultural
Editorial Review. Users Review
 Download and Read Free Online Java SE 8 Programmer I: O guia para sua certificação Oracle Certified Associate (Portuguese Edition) By Guilherme Silveira, Mário Amaral Editorial Review Users Review From
Métodos Quantitativos e Qualitativos na Engenharia (M2QE) Quantitative and Qualitative Methods in Engineering (QQME)
 Quantitative and Qualitative Methods in Engineering (QQME)") Métodos Quantitativos e Qualitativos na Engenharia (M2QE) ------- Quantitative and Qualitative Methods in Engineering (QQME) Guimarães, 3 de outubro de 2013 Escola de Engenharia, Campus de Azurém Some
Métodos Quantitativos e Qualitativos na Engenharia (M2QE) ------- Quantitative and Qualitative Methods in Engineering (QQME) Guimarães, 3 de outubro de 2013 Escola de Engenharia, Campus de Azurém Some
ATLAS COLORIDO DE ANATOMIA VETERINáRIA DE EQUINOS (EM PORTUGUESE DO BRASIL) BY STANLEY H. ASHDOWN RAYMOND R. DONE
 BY STANLEY H. ASHDOWN RAYMOND R. DONE") Read Online and Download Ebook ATLAS COLORIDO DE ANATOMIA VETERINáRIA DE EQUINOS (EM PORTUGUESE DO BRASIL) BY STANLEY H. ASHDOWN RAYMOND R. DONE DOWNLOAD EBOOK : ATLAS COLORIDO DE ANATOMIA VETERINáRIA
Read Online and Download Ebook ATLAS COLORIDO DE ANATOMIA VETERINáRIA DE EQUINOS (EM PORTUGUESE DO BRASIL) BY STANLEY H. ASHDOWN RAYMOND R. DONE DOWNLOAD EBOOK : ATLAS COLORIDO DE ANATOMIA VETERINáRIA
Holding Familiar: visão jurídica do planejamento societário, sucessório e tributário (Portuguese Edition)
") Holding Familiar: visão jurídica do planejamento societário, sucessório e tributário (Portuguese Edition) Fabio Pereira da Silva, Alexandre Alves Rossi Click here if your download doesn"t start automatically
Holding Familiar: visão jurídica do planejamento societário, sucessório e tributário (Portuguese Edition) Fabio Pereira da Silva, Alexandre Alves Rossi Click here if your download doesn"t start automatically
O guia do enxoval do bebê nos Estados Unidos: Dicas e segredos da maior especialista de compras em Miami, Orlando e Nova York (Portuguese Edition)
") O guia do enxoval do bebê nos Estados Unidos: Dicas e segredos da maior especialista de compras em Miami, Orlando e Nova York (Portuguese Edition) Priscila Goldenberg Click here if your download doesn"t
O guia do enxoval do bebê nos Estados Unidos: Dicas e segredos da maior especialista de compras em Miami, Orlando e Nova York (Portuguese Edition) Priscila Goldenberg Click here if your download doesn"t
Livro do Desassossego
 Livro do Desassossego Fernando Pessoa Click here if your download doesn"t start automatically Livro do Desassossego Fernando Pessoa Livro do Desassossego Fernando Pessoa [...] Download Livro do Desassossego...pdf
Medicina e Meditação - Um Médico Ensina a Meditar (Portuguese Edition)
") Medicina e Meditação - Um Médico Ensina a Meditar (Portuguese Edition) Roberto Cardoso Click here if your download doesn"t start automatically Medicina e Meditação - Um Médico Ensina a Meditar (Portuguese
Medicina e Meditação - Um Médico Ensina a Meditar (Portuguese Edition) Roberto Cardoso Click here if your download doesn"t start automatically Medicina e Meditação - Um Médico Ensina a Meditar (Portuguese
Recomendações: evidências e lacunas- Revascularização do Miocárdio. Lacunas
 Recomendações: evidências e lacunas- Revascularização do Miocárdio Lacunas CTO PCI in secondary revascularisation after CABG failure Revascularização do Miocárdio The Guidelines are appropriately conservative,
Este curso de 40 horas fornece-lhe as competências e conhecimentos para o preparar para o exame de certificação CBAP. *
 CBAP Business Analysis Professional Certification Business Analysis Localidade: Lisboa Data: 14 Oct 2019 Preço: 1850 ( Os valores apresentados não incluem IVA. Oferta de IVA a particulares e estudantes.
JOSÉ RICARDO SANCHEZ FILHO ANALYSIS OF THE LONG-TERM EFFECTS OF THE VOLUNTARY OFFER OF THE BID RULE ON STOCKS LISTED IN THE BRAZILIAN STOCK EXCHANGE
 UNIVERSIDADE FEDERAL DO RIO DE JANEIRO INSTITUTO COPPEAD DE ADMINISTRAÇÃO JOSÉ RICARDO SANCHEZ FILHO ANALYSIS OF THE LONG-TERM EFFECTS OF THE VOLUNTARY OFFER OF THE BID RULE ON STOCKS LISTED IN THE BRAZILIAN