openmodeller A framework for species modeling Fapesp process: 04/ Partial Report #2 (April 2006 March 2007)
|
|
|
- Sabrina Belém Pinho
- 8 Há anos
- Visualizações:
Transcrição
1 i openmodeller A framework for species modeling Fapesp process: 04/ Partial Report #2 (April 2006 March 2007)

2 ii Index Introduction...3 Objectives...3 Activities...3 General framework activities/studies...4 Evaluation of parallelization techniques and analysis of parallel algorithms for biodiversity data analysis...4 Initial implementation using Services Architecture...5 Locality data component...5 Study of data-cleaning techniques...6 Environmental data component...6 Pre-analysis component...7 Modeling component...8 Post-analysis component...9 Desktop Interface...9 Study Cases...10 Other activities...11 Publications and Presentations...12 Published or with a new status...12 In preparation...13 General Comments...13

3 3 Introduction openmodeller s project goal is to develop a framework to facilitate the work of scientists in predictive modeling of species distribution. The four year project funded by Fapesp involves three institutions: CRIA (Centro de Referência em Informação Ambiental), Poli (Escola Politécnica da USP), and INPE (Instituto Nacional de Pesquisas Espaciais). This report summarizes the activities carried out during the second year of the project, from April 2006 to March Objectives This project s original aim is to develop a flexible and robust modeling framework to predict species distribution. Main objectives are: develop a component-based modeling framework with reusable modules compliant with web services technology enable use and comparison of different modeling algorithms through the same infrastructure enable modeling pre-analysis and pos-analysis using specific components enable the existence of multiple interfaces (web, desktop, command line, web service) develop a modeling desktop interface fully integrated with GIS functionalities develop a modeling web interface facilitate access to distributed biological and environmental data networks allow usage of high performance computing with species distribution modeling. carry out use cases to test and validate the complete framework. Activities Most objectives planned for the second year of the project involved additional progress over the activities presented in the last report. During the second year, two releases of the openmodeller library were made (the complete change log can be found in annex 1). The first one was a major release (0.4) including the integration with TerraLib and the complete refactoring of the Web Services interface. The other release (0.4.1) included a new algorithm called EnvironmentalDistance and improvements in the locality component. Two other algorithms (AquaMaps and AdaptGARP) were implemented but have not been released yet. The Desktop interface was completely rewritten into a new multi-platform application that supports modeling experiments involving multiple species and multiple algorithms. When using this interface one can run models using resources from a local machine or using remote modeling servers. A new modeling plugin for TerraView was developed, completing the bridge between TerraLib and openmodeller. A computer cluster with 11 nodes (each with 2 quad-core servers) was purchased and shall be installed by the end of April. It will provide high processing power to develop and run models.

4 4 Below is the list of objectives for the project, followed by a summary of activities and the main achievements during the second year. General framework activities/studies Evaluation of parallelization techniques and analysis of parallel algorithms for biodiversity data analysis One of openmodeller s known bottlenecks is projecting the model into a distribution map, especially when the experiment involves many layers with high resolution and the region of interest has a large extent. Map projection was therefore considered a suitable target for applying parallelization techniques. During the last year, the corresponding part of openmodeller code was studied in detail before starting implementation of parallelized versions. The initial implementation is being developed using OPENMP 1 for multiprocessor computers with shared memory. This version is still being tested to achieve maximum performance. During this year a new version using another parallelization technique called MPI 2 (Message Passing Interface) will be developed so that it can take full advantage of computer clusters. More information about this work can be found in annex 16. The purchase of a computer cluster, which was supposed to be completed by December 2006, was delayed due to bureaucratic problems with importation. The cluster is expected to be installed by the end of April at Escola Politécnica da Universidade de São Paulo. Its configuration was updated to incorporate a new quadcore processor which was recently launched. The final configuration of the SGI Altix xe 1300 machine totalizes 11 nodes, or 88 Cores of Intel Xeon 5335, with 2.0GHz/8MB cache, 1333MHz FSB and 88 GB RAM DDR 667MHz. After analyzing the information about tools for cluster management, two of them were identified as potential candidates to be used: Condor 3 and OpenPBS 4. A set of virtual machines was set up to test them. So far Condor seems to meet all requirements, including access control, job checkpoints, remote system calls, job schedulers and additional scalability through flocking. A web portal will be implemented to facilitate job submissions to the cluster. A study about parallelization techniques has been carried out, and after analyzing the existing implementation of the GARP algorithm in the openmodeller framework, a new algorithm called P-GARP was developed (still not available in the public code repository). This algorithm was designed based on the Coarse Grained Model (CGM) technique. It provides a parallel execution of the GARP iterate method, combining the results of each iteration to generate a model. It also uses synchronization barrier and communication round concepts, so that it can be used in a cluster environment. Both algorithms, GARP and P-GARP, were tested in a simulated cluster environment (see annex 11 for results). The MPI standard was also studied and tested with lam-mpi version for Linux. All requirements to run P-GARP with MPI have been defined. Next steps include the implementation of P-GARP using MPI and then testing it in a

5 5 real cluster. Other algorithms available in openmodeller will also be evaluated to see if similar parallelization techniques can be applied. Initial implementation using Services Architecture Considering that openmodeller may require intensive use of computational resources, it is very important to optimize performance for each component and make all necessary adjustments in the architecture. A detailed study was conducted for each individual class using the typical execution flow. The framework was divided into several components and hosted in a distributed architecture that implements inter-process communication between the main process (the engine) and all components. To find bottlenecks, a performance evaluation methodology was devised (see annex 4). The existing code was instrumented using AOP (Aspect Oriented Programming) techniques to allow profiling the code during execution. This approach, together with asynchronous messaging programming, gathered data about the time elapsed in each component and even in each method call. This information was stored into a database and is accessible through a web interface. This work resulted in a performance simulation model that can be used to study the efficiency of different possible architectures for openmodeller and to identify parts of the code that could benefit from parallelization. The prototype and infrastructure that were built are also accessible as a remote service that can process openmodeller requests and collect information about performance. A technical report is being prepared to present a detailed specification of a new architecture for openmodeller considering the domain definition and specific requirements for the framework. This work was based on the definition of the modeling process which was already mentioned in the last report. A preliminary version is being evaluated by developers and users. The latest version of openmodeller includes a full server implementation for the new Web Services API based on SOAP (Simple Object Access Protocol). This API was developed in a partnership with the BiodiversityWorld project 5. It enables the use of remote modeling servers that can be set up on top of a cluster. A formal definition of the Web Services API is available 6, including the following operations: ping, getalgorithms, getlayers, createmodel, getmodel, projectmodel, getprogress, getlog, getlayerasattachment, getlayerasurl and getprojectionmetadata. This API uses the Document/Literal SOAP style and references external elements and types from an XML Schema 7 that also validates openmodeller serialized objects. Locality data component The last release of openmodeller includes a few changes in locality data structures. Each locality provided to openmodeller must now contain a unique identifier so that serialized models and system messages can explicitly reference back to it. All necessary adjustments were made so that absence data can be provided to the library and used by the algorithms. The text file format for the corresponding occurrences reader (used mainly by the console interface) was changed accordingly. It now expects 4 mandatory columns (unique identifier, label, longitude and latitude) and one optional column for abundance. All values must now be separated by TABs
 and all components.")
6 6 Absence points are indicated when abundance is equal to zero. When abundance is not specified, 1 is assumed (presence data). New drivers were developed to retrieve locality data from the GBIF 8 and specieslink 9 networks as part of the Desktop interface. Since there was no official Web Services API on top of GBIF s database, the GBIF driver actually interacts with the search interface of the existing GBIF web portal. During the next year, this driver will be updated to make use of one of the Web Services APIs that will become available from GBIF (either based on WFS 10 or based on the new custom GBIF REST-style API). The specieslink driver is based on a custom HTTP/XML protocol. This network is developing a harvesting system that will feed a centralized database from where occurrence point data will be provided in a much faster way to openmodeller. Both drivers should soon move to the openmodeller locality component. The driver to access a TerraLib database containing locality data was improved and now allows access to TerraLib databases built on top of other Database Management Systems like Oracle, Oracle Spatial, PostgreSQL, PostGIS and SQLServer, besides the initial MySQL server. Broadening the data structure for locality data to make use of data cleaning tools, implementing a Web Services API for data cleaning, effectively making this component interact with a data cleaning service, and defining a final API for this component are some of the next features to be developed. Study of data-cleaning techniques All data cleaning tests mentioned in the previous report were implemented as part of the DataTester framework. Namely: geographic error detection, geographic outlier detection, itinerary error detection and elevation error detection. The following tests were additionally implemented: Environmental outlier detection. Detects outliers on environmental values using a statistical method based on reverse-jackknifing procedure. Ecological outlier detection. Detects outliers based on fundamental niche models (where an outlier is a presence point that has an associated probability of presence lower than a specified value according to a fundamental niche model). Note: this test may not be used by the locality component, but other external tools can make use of it, based on models produced by openmodeller. A new version of DataTester was developed 11 (0.2) and a complete documentation for the API 12 was made available. Environmental data component openmodeller was originally designed to receive references to environmental layers as parameters for both model creation and model projection. These references are usually

7 7 an address in the local file system pointing to a raster file 13. Therefore, the notion about "what layers are available for a modeling experiment" always depended on the users' knowledge about the raster files located in the file system. However, the new remote interaction scenario introduced by the Web Services interface required an additional functionality on the server side to present available layers to users. This was covered by the "getlayers" method. In the existing implementation of the modeling server this method returns all valid rasters that are found in a specific directory (which is determined as part of the configuration) and all sub-directories, recursively. During the last years, more than environmental layers have been used by CRIA in modeling experiments. Of these, approximately are in the public domain and were organized in specific directories to be made available through this new modeling service. These layers basically consist of climate data from IPCC (past, present and future), Worldclim data (temperature, precipitation and altitude), topographic data from Hidro1K and vegetation index measurements derived from the Advanced Very High Resolution Radiometer 14 (AVHRR). Annex 13 contains more information about all available layers. Access to remote raster data from openmodeller is also possible through the TerraLib driver, which can open connections to remote TerraLib databases. A recent version of GDAL 15 (1.4.0) adds support to remote rasters that are accessible through the Web Coverage Service 16 (WCS). This version of GDAL will be tested with openmodeller during this year. Pre-analysis component Sub-sampling locality data into test and training datasets has been implemented to allow extrinsic model validation. This takes place in the SamplerImpl class as a global function called splitsampler that can also keep the original proportion of presences and absences in the new partitions. SamplerImpl is the main class to be used by most pre-processing techniques (documentation about this class can be found in annex 7). openmodeller also provides ways to visualize occurrence points from both the geographical and environmental viewpoints to check if the current samples are widely or poorly distributed in the region of interest from the users perspective. The console interface includes two programs called om_viewer and om_niche for these purposes, respectively. The Desktop interface has now basic GIS capabilities to display the original points on top of the generated distribution maps. Conceiving a way to measure how spread out or concentrated are the occurrence points in the environmental dimensions is another feature to be developed. A new study case is being carried out to compare two algorithms (GARP Best Subsets and Support Vector Machines) which will include two experiments: the first one using a large number of layers, and the other one using only the most important layers after running several pre-analysis techniques like k-means, single-link, average-link, shared nearest neighbors and clustering ensembles (multi-objective, Strehl and Ghosh). The 13 For TerraLib rasters, the address has a specific format to point to a table inside a TerraLib database

8 8 results of this study case will be used to determine which techniques should be implemented as part of the pre-analysis component. It is also expected that this will provide enough information to check if it is possible to specify a standard pre-analysis interface or if it will be necessary to have multiple interfaces according to each type of pre-analysis technique. Modeling component A new algorithm called Environmental Distance (see annex 15) unified and generalized the existing distance-based algorithms in openmodeller: Minimum Distance and Distance to Average. The new algorithm uses a linear scale of probability between a reference point and a limit specified by the maximum distance parameter. Distances can be calculated using three different metrics: Euclidean, Gower (Manhattan) and Mahalanobis. The reference point is determined by the mean of the n nearest points, where n is another parameter. When used with Gower and maximum distance of 1, this algorithm is equivalent to the algorithm known as DOMAIN 17. Chebyshev is being implemented as a new metric option and will be released in the next versions. Another algorithm specifically designed to model the distribution of marine organisms was developed in openmodeller through a partnership with the Incofish project 18. AquaMaps is based on the idea of environmental envelopes, where each variable has an associated preferred range and a broader accepted range. This algorithm differs from other traditional ones since it requires a fixed set of layers to work: maximum depth, minimum depth, sea ice concentration, distance to land, primary production, salinity and sea surface temperature. It also makes use of expert information for the lower and upper limits of each variable and it reads depth ranges from a local database provided by FishBase 19 containing data for approximately 30 thousand species. AquaMaps is already available in openmodeller s code repository, but since it s still being tested by the Incofish experts and also awaiting publishing it has not been publicly released. An adaptive variation of the GARP algorithm, called AdaptGARP, was implemented but is not yet available in the code repository. AdaptGARP makes use of adaptive decision tables, including an adaptive crossover operator and an adaptive mutation operator. The two algorithms, GARP and AdaptGARP, were tested and compared using two different data sets. For each data set, 14 experiments were performed and the performance was almost identical for both algorithms (see annex 10 for results). The comparison metric used the number of iterations as a function of the fitness value. This work also showed that Adaptive Decision Tables can simulate any genetic algorithm without performance loss, and that previous developments on the subject are a special case for a particular genetic algorithm, e.g. the GARP algorithm. Furthermore, a significant conceptual gain is obtained since the simulation of genetic algorithms using adaptive devices allows both genetic representation and operators to be unified. 17 Carpenter, G., Gillison, A. N., and Winter, J. (1993). DOMAIN: A flexible modeling procedure for mapping potential distributions of animals and plants. Biodiversity and Conservation, 2,
 unified and generalized the existing distance-based algorithms in openmodeller: Minimum Distance and Distance to")
9 9 A new document was created to help algorithm developers to contribute to the project. The text contains detailed explanation of the main data structures and methods, including a step-by-step algorithm creation example telling what each line of code does (see annex 5). A presentation called "High level vision to algorithms, data structures and algorithm sequence" was also prepared. It contains an informal description of the data structures and main concepts that need to be understood, and it shows a brief step-by-step sequence of the methods that are invoked during algorithm execution (see annex 6). Post-analysis component Model validation is considered one of the priorities for the post-analysis component. openmodeller currently offers basic model validation by calculating accuracy, omission and commission errors. This functionality is available from the ConfusionMatrix class (see annex 8 for class documentation). A new command-line tool (om_testsample) was developed and is available in version to run extrinsic tests. It loads a serialized model, tests each point in a separate file and generates the confusion matrix. Different validation tests shall be included in the future. Another type of validation test known as ROC Analysis is being developed and should be available in the next versions. ROC Analysis provides a global quality measure based on the area under the curve (AUC) which is now being used by several experiments because it does not depend on a cutoff limit that is normally used by other techniques, such as confusion matrix. Basic statistics about distribution maps can be generated by using the AreaStats class (see annex 9 for class documentation). This includes the total number of cells and the number of cells where presence was predicted. Hotspot analysis was developed as part of the new Desktop interface. This technique can be used to aggregate multiple distribution maps creating a single hotspot map. The same functionality can now be migrated to the framework. Desktop Interface During this year, releases to of openmodeller Desktop were produced. openmodeller Desktop is a complete rewrite of the previous omgui application. The rewrite was prompted by the need to create an application that meets the needs of 'power users' and that employs a modular and extensible architecture (see annex 3 for the complete technical training report related to this work). openmodeller Desktop progressed to the point of being a useable, user friendly front end to openmodeller library with a rich feature set. Experiments involving multiple species and multiple algorithms can easily be carried out. Plugins were written, allowing modeling tasks to be run on the local machine using libopenmodeller, or on a remote machine via the openmodeller Web Service API. Plugins were also written that facilitate automated occurrence data retrieval from specieslink 20 and GBIF 21 online databases. This new version also sports a new embedded GIS component that allows

10 10 users to interactively explore resulting distribution maps. The latest release includes installation packages for Windows and GNU/Linux. Annex 12 contains a brief analysis of the Windows version. Within the next months another installation package will be made available for Mac OSX. With the basic functionality for carrying out modeling in place, the plan for the next year is to further extend openmodeller Desktop to allow projection into multiple climate scenarios as part of the same experiment, automate model testing and provide tools for visualizing models in the environmental space. A new TerraView 22 modeling plugin was developed as a separate application. TerraView is a GIS that can be used to build a TerraLib database, as well as to query and visualize its contents in several types of output (such as graphs, maps or charts). It also includes a set of spatial analysis tools for knowledge discovering. This plugin is an independent interface that can be plugged to the currently distribution of TerraView for openmodeller users, providing a bridge between openmodeller components and the TerraView database. This plugin is available from openmodeller s Subversion repository. A more detailed description can be found in annex 2. Study Cases Three study cases were carried out at CRIA to assess species distribution models: Comparison of two different algorithms (GARP and Maxent) in modeling the potential habitat of maned wolf (Chrysocyon brachyurus). The main objective was to know the consequences of actual habitat fragmentation and impacts of future climate changes for this species. Performance test of two different algorithms (GARP and SVM Support Vector Machine) in modeling the Cerrado tree species (Stryphnodendron obovatum). The main objective is to compare the accuracy of these algorithms and test the effect of using a high number of environmental layers in the process. This study is not finished yet. Application of different algorithms (Bioclim, GARP and MaxEnt) to compare the known and potential geographic distribution of Hennecartia omphalandra (Monimiaceae). Two study cases were carried out at INPE to assess species distribution models: Fabio Iwashita s master thesis (to be concluded in March 2007) assesses the sensibility of species distribution models according to the precision of locality data. Two algorithms implemented in openmodeller (GARP and BIOCLIM) and Maxent were evaluated (Iwashita, 2007). Different environmental data were tested to achieve better results and optimize modeling procedures. In particular, Normalized Difference Vegetation Index (NDVI) was used to model the genus Coccocypselum (Rubiacea) (Amaral et al., 2007). In the last report there was a plan to assess phylogenetic diversity and spatial distribution of Bignoniaceae in the Amazon. Unfortunately, the scholarship was denied. Another study was carried out using a Rubiaceae database, applying knowledge derived from modeling to techniques that help in the conservation of species and 22

11 11 recuperation of degraded areas. Species of Rubiaceae, from the genus Coccocypselum P. Br., were used to test the effect of environmental data on the distribution models. This work also discussed the conservation aspect, contrasting the genus predicted distribution and diversity with the conservation units already established in the Brazilian territory (Costa et al., 2006). A specific TerraLib database with raster data for niche modeling was prepared at INPE. Aside from the environmental data usually considered for this purpose, climate data from CPTEC-INPE, remote sensing imagery, and other maps describing the biophysical environment were used. This activity was carried out during the modeling processes of Rubiaceae, and was also used to successfully test the interface between openmodeller and TerraLib. Other activities During the year it was felt that a greater proximity of the project teams of the 3 participating institutions was necessary to promote greater interaction. As of June, 2006 to March 2007, 8 seminars were held to present new developments and to advance other discussions about the project. A summary of all seminars can be found in annex 14. As an additional result from the openmodeller project, a study group on Biodiversity Modeling was structured at INPE. Several research initiatives, as papers and thesis, are focused in questions related to biodiversity modeling theory and computational tools. Students and researchers involved promote monthly meetings, called Referata Biodiversa 23 where ecological and computational aspects of the biodiversity modeling process are presented and discussed. The main objective is to promote the debate about biodiversity and modeling, integrating this multidisciplinary team. CRIA began offering in house training and remote counseling mostly to graduate students that, in return, contribute their findings to the project and help to improve the tools. The following students were trained in the period, being supervised by Dr Marinez Ferreira de Siqueira: Renata Sayuri Kawashima - Instituto Nacional de Pesquisas Espaciais (INPE). Modeling of the potential geographic distribution of the manded wolf (Chrysocyon brachyurus) and future climate implications. Date: July/August 2006 Sonia Mireya Sua Tunjano - Instituto Amazônico de Investigaciones Científicas (SINCHI), Bogotá, Colômbia. Modeling of potential geographic distribution of woody Amazonian species. Date: October/2006 Marcos Gonzáles - Escola Nacional de Botânica Tropical, Jardim Botânico do Rio de Janeiro (JBRJ). Master student. Known and potential geographic distribution for Hennecartia omphalandra Poisson (Monimiaceae). Date: October/2006. Dr Marinez Ferreira de Siqueira also conducted the course Biodiversity Modeling at the Instituto de Pesquisas Ecológicas (IPE), Nazaré Paulista, SP. Date: Mach, 23-25/2007. From February 13th to 15th Tim Sutton and Alexandre C. Jardim met at CRIA to discuss and plan the integration of TerraLib in the new Desktop interface. 23

12 12 The art package was finished, documented and is publicly available 24. art is an R 25 package integrating R with TerraLib GIS classes. It allows spatial data to be analyzed with R. Publications and Presentations Published or with a new status Amaral, S.; Costa, C. B. and Rennó, C. D. Normalized Difference Vegetation Index (NDVI) improving species distribution models: an example with the neotropical genus Coccocypselum (Rubiaceae). In: Simpósio Brasileiro de Sensoriamento Remoto, 13, Araujo, J.; Correa, P. L. P.; Saraiva, A. M.; Sato, L.; Sutton, T.P. and Franco, M. A (submitted). Framework for Species Distribution Modeling - A performance evaluation approach. In: Ecological Informatics ISEI2006, 2006, Santa Barbara - California. Proceedings of Ecological Informatics ISEI2006, 2006 (full paper submitted to Ecological Informatics Journal Elsevier). Bonaccorso, E., Koch, I. and Peterson, A.T Pleistocene fragmentation of Amazon species' ranges. Diversity and Distributions, 12: Bravo, C. Neto, J.J, and Santana, F.S. (submitted). Unifyinig Genetic Representation and Operators in an Adaptive Framework. Paper submitted to Analysis of Genetic Representations and Operators, AGRO Bravo, C. Neto, J.J, and Santana, F.S. (submitted). Towards an adaptive implementation of genetic algorithms. Paper submitted to First IEEE International Conference on Self-Adaptive and Self-Organizing Systems, Costa, C. B.; Amaral, S. and Valeriano, D. M Presence-only modeling method for predicting species distribution and species richness: an example with the widespread Rubiaceae genus Coccocypselum. In: XVI Congresso da Sociedade Botânica de São Paulo, 2006, UNIMEP, Piracicaba, São Paulo de setembro de Fook, K.; Monteiro, A. M. V. and Câmara, G Web Service for Cooperation in Biodiversity Modeling VIII Brazilian Symposium on GeoInformatics, GeoInfo2006. Campos do Jordão, SP, Brazil, Available at Iwashita, F Sensibilidade de modelos de distribuição de espécies à qualidade do posicionamento de dados de coleta. Master Thesis in remote sensing (INPE) Instituto Nacional de Pesquisas Espaciais, São José dos Campos, Kawashima, R.S., Siqueira, M.F. and Mantovani, E. (accepted). Modeling of the potencial geographic distribution of the manded wolf (Chrysocyon brachyurus) and future climate implications. Biota Neotropica. (Paper submitted in 10/26/2006). Kawashima, R.S., Siqueira, M.F. and Mantovani, E. (submitted) Dados do monitoramento da cobertura vegetal por NDVI na modelagem da distribuição
.")
13 13 geográfica potencial do lobo-guará (Chrysocyon bracyurus). XIII Simpósio Brasileiro de Sensoriamento Remoto. Florianópolis, SC. Abril 2007 (paper accepted). Santana, F.R.Fonseca, R.R., Saraiva, A.M. Correa, P.L.P., Bravo, C. and De Giovanni, R openmodeller - an open framework for ecological niche modeling: analysis and future improvements. World Congress on Computers in Agriculture and the Environment proceedings. July, Orlando. (Paper published in proceedings and oral presentation.) Santana, F.S., Bravo, C. Saraiva, A.M. and Correa, P.L.P. (submitted) P-GARP (Parallel Genetic Algorithm for Rule-set Production) for clusters applications. Ecological Informatics Journal (submitted in December 2006). Santana, F.S., Siqueira, M.F., Saraiva, A.M. and Correa, P.L.P. (2006) A meta-model for species spatial distribution modeling process based on ecological niche concepts. 5th International Conference on Ecological Informatics. December, 2006 Poster presentation.. Santana, F.S., Bravo, C. and Saraiva, A.M. (to be submitted) P-GARP implementation requirements for the openmodeller framework using the MPI standard. To be submitted. Siqueira, M.F. and Durigan, G. (accepted). Modeling of geographic distribution of Cerrado s tree species in State of São Paulo, Brazil. Revista Brasileira de Botânica. (Paper submited in 28/09/2006). In preparation Gonzales, M., Peixoto, A.L. and Siqueira, M.F. (in preparation). Konwn and potencial geographic distribution for Hennecartia omphalandra Poisson (Monimiaceae). Muñoz, M.S., De Giovanni, R., Siqueira, M.F., Sutton, T.P., Brewer, P., Scachetti- Pereira, R., Canhos, V.P., Canhos, D.A.L., openmodeller Generating niche models using a generic framework. Santana, F.S., Murakami, E and Saraiva, A.M. (accepted) A comparative study between precision agriculture and biodiversity modeling systems. Accepted by EFITA (July 2007, Glasgow). 80% finished. Santana, F.S. Siqueira, M.F., Bravo, C. And Saraiva, A.M. Results of experimentation on Ecological Niche Modeling. (20% finished provisory title). Santana, F.S.. Uma arquitetura de referência para sistemas de modelagem ambiental da biodiversidade. Research plan for the post-graduate program at the Escola Politécnica da Universidade de São Paulo. Supervisor: Prof. Dr. Antonio Mauro Saraiva. General Comments During the second year, there was a general expectation from all participant institutions to bring more people to work on the project by means of scholarships and trainingships. Ten proposals were submitted but only four were accepted (one of them began only in 2007). It is important to mention that in all cases the reasons for denial were not related to the merit of work plans or to the quality of candidates, but to the limited number of scholarships available. This had a great impact on various activities, mainly those related to the pre and post processing components. We are trying to find new ways of bringing more people to the project, by establishing new partnerships with other institutions, and are hoping to overcome this situation soon.
 P-GARP (Parallel Genetic Algorithm for Rule-set Production) for clusters applications. Ecological Informatics Journal (submitted in December 2006). Santana, F.S., Siqueira, M.")
14 14 Access to biological data from the Amazon region has proved to be more difficult than originally expected. The focus on the Marajó-Tocantins area proposed in the last report is no longer feasible since the necessary partnership that would enable access to data has failed. We would still like to keep the Amazon region as one of the main targets for the next studies, but if the difficulty persists to gather reliable and accurate species occurrence data as well as taxonomic information, the study area will be changed to another region in Brazil. No further progress has been made in the Web Interface that was prototyped during the first year. A technical trainingship with this specific target is being submitted together with this report. A new algorithm using Neural Networks was expected for the second year of the project but could not be implemented. We were actually expecting three new algorithms (Neural Networks, Decision Trees and Support Vector Machine) as part of a Postdoctoral scholarship which unfortunately was denied. On the other hand, three other algorithms were implemented (EnvironmentalDistance, AquaMaps and AdaptGARP). A proposal for a technical trainingship specifically related to Neural Networks is being submitted with this report. Launching of a more stable desktop version and offering training to biologists and ecologists is stimulating the use of the application which we expect will result in a more detailed analysis and a greater demand for new features. The implementation of parallelization techniques in various parts of the code and the availability of a computer cluster dedicated to modelling tasks should soon enable large experiments to be conducted in shorter time.

15 15 Annex 01 Release ( ) * New algorithm "Environmental Distance". * Changed OccurrencesReader to handle presence and absence points separately. * Changed occurrences file format (now TAB-delimited with each point having a unique identifier). * Initial support to the cmake build system (should work for GNU/Linux and Mac OSX). Release 0.4 ( ) * Integration with TerraLib. * Removed the algorithm Bioclim distance. * Changed the default output map file type to ERDAS Imagine ".img". * Refactored SOAP interface which now covers all modelling functionality. * Re-enabled the new version of GARP (v3). * Several fixes in the SWIG-Python binding. * Fixed installation issue with the RPM packages.
. * Several fixes in the SWIG-Python binding.")

16 16 Annex 02 APPENDIX 1. O Plugin do openmodeller para o TerraView permite gerar modelos e projeções acessado dados diretamente de uma base TerraLib, sem ser necessário o uso de outro software externo ao TerraView, para isso é necessário selecionar: Os algoritmos e seus parâmetros - Figura 1; O sistema de coordenadas da projeção (output) - Figura 2; Os dados de localidade de uma ou mais espécies (layer, tabela, coluna e espécies) - Figura 3; Os dados ambientais para gerar o modelo e a projeção - Figura 4; E a mascara e o formato de saída do modelo e da projeção - Figura 5; O nome do layer de saída; O diretório onde serão gerados os arquivos de log. Através do botão Last Model é possível carregar a ultima configuração usada para gerar um modelo e projeção. Depois de selecionados todos os parâmetros ao clicar no botão Finish o modelo e a projeção começam a ser gerados. Uma janela mostra o progresso da construção do modelo e da projeção, o nome da espécie sobre a qual esta gerando o modelo e a projeção no momento, o numero de espécies que já foram analisadas até o momento, e o numero total de espécies - Figura 6. Depois de prontos o plugin se fecha automaticamente e a projeção fica disponível para se visualizada através do TerraView - Figura 7. Figura 1 - Algoritmos e Parâmetros.
 - Figura 3; Os dados ambientais para gerar o modelo e a projeção - Figura 4; E a mascara e o formato de saída do modelo e da projeção - Figura 5; O nome do layer de saída; O diretório onde")
17 17 Figura 2 - Sistema de coordenadas. Figura 3 - Espécies.

18 18 Figura 4 - Camadas Ambientais. Figura 5 - Mascara e o formato de saída.

19 19 Figura 6 - Janela de Progresso. Figura 7 - Projeção visualizada no TerraView com legenda.

20 Annex 03 20

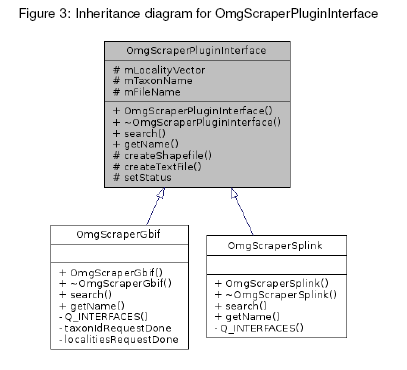
21 21 1 Work Completed 1.1 Migration to a desktop application paradigm The openmodeller Wizard (which is no longer under active development) was based on a wizard paradigm, leading the user through a series of sequential steps to culminate in the generation of an ecological niche model. This wizard paradigm has limitations however. In particular it requires repetitive data entry and is not able to remember anything other than the choices made in the previous session. This means that when the user wishes to experiment with different algorithm parameters or environmental layer combinations, they are required to hand enter this information each time. The move to a desktop application paradigm has increased the learning curve for users new to the application, but it increases the power and flexibility of the application. The new openmodeller Desktop incarnation follows a more traditional approach of accessing functionality via menus, icons and a variety of dialogs. This allows significantly more functionality to be provided within the application than could otherwise be offered within the linear workflow of a wizard application. Statement of work: openmodeller Wizard has been rewritten as a desktop application 1.2 Migration from Qt3 to Qt4 The Qt3 C++ toolkit by Trolltech (1http://trolltech.com/) provides a framework for building cross platform Graphical User Interfaces (GUIs). Building a cross platform GUI application is a non trivial task. Fortunately the Qt toolkit makes this process easier by providing a uniform API on all major operating systems. It provides an abstraction layer for the operating system s native GUI tools, so a cross platform application written in Qt still has a native look and feel. Certain issues with Qt3 prompted the migration to Qt4, including: no support for network access via http proxy; the windows version of Qt3 is not available under the GPL; Qt3 is being superceded by Qt4. Various other technical reasons prompted the move to Qt4, not least of which was the idea that openmodeller Desktop as a green fields new application should make use of the very best of available current technologies. With this rationale in mind the codebase from the openmodeller Wizard interface that was a likely candidate for re-use in openmodeller Desktop was ported to Qt4. This involved manually updating all the deprecated Qt3 API calls to their Qt4 replacements. All new code was written to be compliant with the Qt4 toolkit. Statement of work: Existing Qt3 code was rewritten to be Qt4 compliant. All newly written code is Qt4 compliant. 1.3 Modular Architecture One of the goals of the migration to Qt4 and from a wizard style to a desktop style application was to improve the architecture of the application. The wizard based version was written as a proof of concept and employed a monolithic architecture. In addition the application logic was tightly coupled to the user interface which did not facilitate code re-use. Because of this the new openmodeller Desktop adopts a more modular architecture to maximise code re-use and to better embrace the principles of Object Orientated Design. Core application logic has been implemented in a separate library (libomg core) and provides functionality that can be used effectively from various parts of the graphical user interface. As part of the modular design, a plugin approach (using the Qt4 plugin helper infrastructure) was developed where applicable to promote application extensibility with clearly defined Application Program Interfaces (APIs). Currently two plugin APIs have been implemented: modeller plugins and scraper plugins. These are discussed in more detail in Section and Section
22 22 In addition to modularising via plugins, the code was also written with a discrete non-gui support library that provides all the backend functionality for the application. This includes classes to represent the various entities within the application such as an experiment class, a model class, classes for representing algorithms, algorithm parameters, layer sets, layers and so forth. This library (libomg core) is used by the GUI to carry out the running of models, the reprentation of various data objects and so forth. Four core classes were implemented in the GUI part of the code: the main window, the layer set manager, the algorithm profile manager and the experiment designer. A number of other gui components were also implemented in order to provide functionality for user preferences, pre and post processing of data and so on. These three discrete areas (GUI, omg core, and plugins) provide for a modular three tiered architecture as illustrated in Figure 3 This modularity opens up interesting future possibilities, for example using lib core in other applications to provide access to its high level, non-gui modelling workflow logic. It is also planned to use some of the desktop application classes to implement new versions of QGIS and TerraView plugins (which will embed openmodeller functionality inside these applications). Finally the separation between the application logic in omg core and the user interface will allow us in the future to re-implement a Wizard interface within the openmodeller Desktop application while reusing much of the code that already exists. This will allow us, then,to meet the needs of novice and advanced users alike with minimal code and effort duplication. Statement of work: Much work was carried out in the design of openmodeller Desktop so that it properly reflects Object Orientated design principles Modelling Engine Plugins While the openmodeller Wizard implementation of the graphical user interface was tightly coupled to the openmodeller library, in the design of openmodeller Desktop a loosely coupled architecture was preferred. This was mainly preempted by the development of the openmodeller Web Service specification which provides an API specification for remote execution of openmodeller jobs. Having two invocation methods for openmodeller (via local library or remote web service) mandated re-architecting the original openmodeller Wizard code base into something more flexible. Special care was taken in the specification of the openmodeller Desktop modelling plugin API to ensure that the user would be able to switch between plugins in a seamless manner. As a result of this work, the modeller plugins, as implemented, allow the user to continue to use the same workflows in the application regardless of which plugin is active. Currently two plugins have been implemented (for local and remote web service execution) and both have been tested and are useable. Further work is being carried out to improve their robustness and performance. The modeller plugin API is shown in Figure 3. The plugin approach taken paves the way for addition plugins to be written for any new modelling engine that may be developed in the future. Statement of work: A pluggable architecture was designed for interfacing with the modeller backend. Two modeller plugins have been written to allow local and web service based models to be run Scraper Plugins One of the tasks a user of openmodeller Desktop regularly needs to perform is the retrieval of species occurrence data. Various online databases exist (e.g. specieslink, GBIF Portal) that provide easy browser-based or programmatic access to occurrence data. Typically the data will be returned to the user in response to a web query sent to the server that includes a scientific name of the species for which the data is required. Since these pages return data in HTML, screen scrapers were written to programmatically retrieve data from online databases and then parse the results into a format that is useable by openmodeller Desktop. From this original concept, a plugin API for automating occurrence data retrieval was written.the purpose of the plugin API is to provide a generalised interface for connecting to more such datasources in the future. The scraper plugin API is shown in Figure 3. More recently these services have been
23 23 moving to providing programmatic access to data. The plugins, as written, work but need to be updated in the future to make use of these new programmatic interfaces. At that point they will no longer make use of screen scraping techniques, but rather simple XML DOM parsing operations. For legacy reasons this class of plugins are still referred to as scraper plugins however. Statement of work: A pluggable architecture was designed for interfacing with and retireving data from online databases. Two plugin implementations were written for retrieving data from specieslink and the GBIF portal 1.4 Embedded GIS capabilities for browsing model outputs The modular architecture of openmodeller Desktop supports deployment of core application logic into other applications such as Desktop GIS. However, providing access to basic GIS functions within the openmodeller Desktop environment streamlines the process of viewing the models produced during an experiment, whilst still giving access to all the rich modelling centric functionality of the openmodeller Desktop applicaton. Quantum GIS (QGIS) libraries were used to provideembedded GIS functionality within openmodeller Desktop. As a result of this work, the user is able to zoom in, zoom out, pan and zoom to full extents for any output raster produced by the modelling adapter in use (e.g. the openmodeller library, the openmodeller Web Service). openmodeller Desktop with embedded GIS functionality is illustrated in Figure 3. This is a great improvement over the the original openmodeller Wizard implementation as it was only able to display model results as static images with no navigation and overlay facilities. Providing the option of embedding openmodeller Desktop functionality into QGIS ( and TerraLib ( (as was available in the openmodeller Wizard implementation) is planned for the future. Statement of work: GIS facilities within openmodeller Desktop were made available by creating a map viewing component based on the QGIS libraries. 1.5 Reporting and Provenance One of the deficiencies of the previous openmodeller Wizard GUI was the lack of a proper logging, reporting and provenance.the development of openmodeller Desktop has included a new emphasis on reporting. For each model generated, full details of the input datasets, algorithm and algorithm parameters, model run duration, extracted environmental values, modeller engine logs etc are compiled into a report which can easily be printed out. In addition, when a suite of models have been executed, a report for all models can also be generated. Statement of work: Application logic was written to provide a detailed report for each model that has been run. 1.6 Environmental Values Extraction In addition to the ability to gather and report on all the provenance for a model, the facility was added to display and export the extracted environmental values for each occurrence point into a comma separated values (CSV) output format. A typical output from this work is shown as Table 1. This provides a useful means to take the data that was used by openmodeller library to generate a model and export it into statistical applications or excel for further off-line analysis. Statement of work: Code was implemented to parse the xml returned by the modeller plugin and render the environmental values for each occurrence point. Additional code was written to enable exporting this to a delimited text file.

24 24 Table 1: Environmental Value Extraction: openmodeller Desktop can export extracted environmental values into a delimited text file. An example of the typical contents of such a file is shown here. 1.7 Set based layer management Another limitation of the openmodeller Wizard was the fact that working with different and discrete environmental datasets required frequent recapture of the appropriate filenames to be used. In cases where the user wishes to create models based on numerous different environmental scenarios and geographic region, this process can be extremely time consuming and repetitive. openmodeller Desktop adopts a set based aproach to layer management. The user friendly layer manager (see Figure 3) allows the user to build an assemblage of layers and ascribe some metadata to it (name and description). This assemblage is called a layer set. Once the user has created a layer set it can be simply selected by name in other parts of the user interface. With multiple layersets defined, the user can quickly and effortlessly switch between layer sets when running models. Statement of work: A layerset manager GUI was implemented. The application architecture was implemented to allow the user to deal with layers as conceptual collections rather than individual entities. 1.8 Profile based algorithm management The openmodeller Wizard provides the user with the ability to define specialised parameters for the algorithm being used. However when trying a variety of different parameter combinations over successive model runs, the user is required to remember the parameters used and the application has no way of storing these parameters persistantly. With openmodeller Desktop this shortcoming is addressed through the implementation of the Algorithm Profile Manager (see Figure 3). The algorithm manager provides the end user a simple and efficient method for carrying out large numbers of models using algorithms with a variety of different settings. For example the user can specify a number of variants of the Bioclim algorithm with slightly different parameters (e.g. 0.4, 0.6 and 0.8 cutoff). When constructing an experiment in the openmodeller Desktop interface, the user can user can select 1 or more algorithm profiles and in one operation repeat the model for each species one time per algorithm profile. This is a key enabling technology in meeting the goals of the new desktop user interface - it allows for very large experiments using many algorithm profiles to be conducted with relative ease. Statement of work: A profile based approach to managing model parameters was developed to obviate the need for repetitive data entry and to support the conduction of large scale experiments. 1.9 Cross-platform application deployment and compilation In addition to the above goals much attention was placed on creating an application architecture that could be compiled on the three major desktop platforms (Windows / Mac OSX / GNU/Linux) and on developing strategies for packaging and deployment on the aforementioned platforms. Currently openmodeller Desktop is available for the Windows and GNU/Linux platforms and work is ongoing in porting it to the Mac OSX environment.
25 25 Under windows a build environment was developed using Mingw ( ) and the gcc ( compiler. A user installer tool was developed using NSIS. The installer can be run in both Portuguese and English. The development version of the installer tool that has been written also provides automated downloading and installation of sample environmental data. The windows installer makes it very easy for users to install openmodeller on their desktops. From an application deployment point of view, GNU/Linux presents some problems in that there are a number of competing installer package formats. Catering for the various formats (rpm, deb, ebuild etc) requires a significant investment of time and effort. As a further complication, different distributions and versions of the same distribution provide different application dependencies, making package deployment a potentially onerous task. Some time and effort was devoted to identifying potential solutions and eventually it was decided to use BitRock ( installer. BitRock is non free software, but the choice of using it was pragmatic - since there is a lack of suitable free software equivalents. Bitrock was contacted by the author to ask for a free license since openmodeller Desktop is an open source project. Bitrock generously donated a copy for use in the openmodeller project. From the users point of view, BitRock provides a similar user experience to installing an application under windows. Building the installer took a fair amount of effort since it required compiling all application dependencies and writing various scripts to ensure when the bitrock installed application is executed it uses the correct library search path to fine libraries and data that the application depends on. Cross platform compilation was achieved using the Qt4 qmake build system. This build system does have some limitations however, in particular: on Mac OS X the build will not work when QGIS integration is enabled due to multiple symbol import issues. This has prevented the creation of Mac OS X application bundles for general distribution to date qmake does not automatically find the build dependencies on the system within the project we are using multiple build systems: qmake, automake and Visual Studio Solutions To address these issues, work has started on the creation of a unified build system using cmake ( This will allow the openmodeller Library and openmodeller Desktop to be built for all operating system with both gcc and msvc compilers using a single build system and will significantly reduce the overhead (both in terms of user support and in terms of developer time) that currently goes into maintaining three different build systems. Using cmake the author is now able to compile openmodeller and openmodeller Desktop on the Mac OS X platform. A generally available Mac OS X application bundle is expected to be available in the near future. Statement of work: openmodeller Desktop has been developed to be able to run on all three major desktop operating systems. Currently Windows and GNU/Linux installers are available, with a redistributable Max OS X application bundle to be available in the near future Tracking changes to libopenmodeller The openmodeller library and the openmodeller Web Services interface have been under ongoing development during the course of the reporting period. In order for the modelling plugins to continue working against the most current versions of libopenmodeller and the openmodeller Web Service, regular code revisions were made. This has enabled new features in the library to be available within openmodeller Desktop within a short period of them being implemented. Statement of work: openmodeller Desktop was kept current with ongoing developments in the openmodeller Library and openmodeller Web Services.
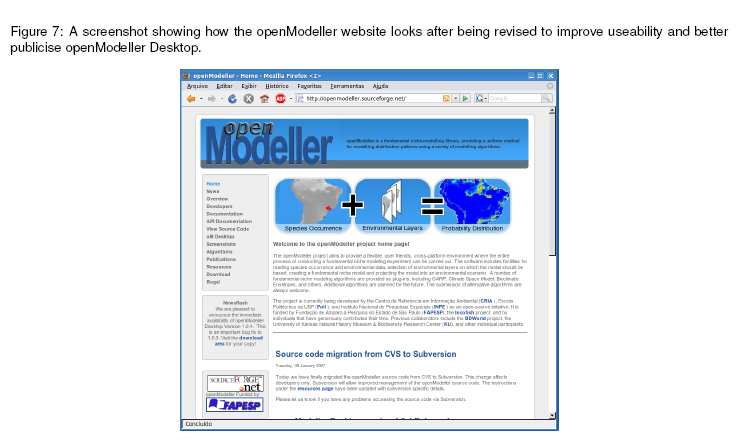
26 Pre and post processing tools A set of classes were written for pre processing environmental data to produce aggregate layers. For example from average monthly temperature and average monthly rainfall, we can compute new layers such as rainfall in month with highest temperature. The backend logic for this has been implemented but further work is required to expose this via the user interface. Post processing tools were incorporated into openmodeller Desktop to produce false colour representations of the grayscale model outputs, and to produce a GIS shapefile from the original occurrence points. A hotspot tool was also produced and is undergoing some minor bug fixing before being made generally available via an openmodeller Desktop end user release. Statement of work: Initial pre and post processing tools have been implemented. Some of these tools are already included in the public version of openmodeller Desktop, while others are in the final stages of development and quality control and will be made available in a future release Internationalisation The Qt4 provides a framework for internationalisation. This framework was used to ensure that text openmodeller Desktop can be translated into different languages. Work was done to make the build system automatically generate updated translation files, and to automatically detect the current system locale and use an appropriate language. Marinez Ferreira de Siqueira assisted by performing a Portuguese translation. Through this work the openmodeller Desktop interface can be used in English or Portuguese, and the possibility now exists to easily add additional language translations in the future. Statement of work: openmodeller Desktop is internationalised, with ability to use it in English or Portuguese. 2 Impacts of work on the greater project 2.1 Project Publicity A software project cannot exist in isolation from its users. During the reporting period, much effort was made to set up an infrastructure for disseminating information relating to openmodeller Desktop and the openmodeller Project as a whole. This included a revision of the openmodeller home page ( The revision had three main aims: 1. To improve general clarity and effectiveness with which the openmodeller project is described; 2. To make navigation and finding relevent information easier for the visitor; 3. To update the resources relating the the graphical user interface to reflect the new developments of openmodeller Desktop. The revised version of the openmodeller home page is illustrated in Figure 3. Early releases of openmodeller Desktop were not widely advertised or distributed due to the fact they were considered snapshot release and not ready for general useage. Sourceforge provides a monitoring infrastructure that allows the amount of traffic to the web site to be visualised. When the first releases of openmodeller desktop were made at then end of December 2006, the project was advertised on several high profile mailing lists, blogs and software directory listings. The effect was evidenced in the increase in the number of downloads (see Figure 3 ). Since openmodeller Desktop has been released it has been downloaded over 500 times.
27 Publications and Presentations The author participated in the writing of the following scientific papers, one of which has been submitted for publication, and the other which is in preparation for being submitted: Araujo, J.; Correa, P. L. P.; Saraiva, A. M.; Sato, L.; Sutton, T.P. ; Franco, M. A Framework for Species Distribution Modelling - A performance evaluantion approach. In: Ecological Informatics ISEI2006, 2006, Santa Barbara - California. Proceedings of Ecological Informatics ISEI2006, 2006 (full paper submitted to Ecological Informatics Journal - Elsevier). Muñoz, M.S., De Giovanni, R., Siqueira, M.F., Sutton, T.P., Brewer, P., Scachetti-Pereira, R., Canhos, V.P., Canhos, D.A.L., openmodeller A generic framework for niche modelling. (in preparation) The author also gave a presentation at the Taxonomic Databases Working Group (TDWG) 2006 conference in Missouri ( The openmodeller project was described and an overview of the openmodeller Web Service API was given. The abstract for this presentation is provided below. The presentation was very successfully at publicising the openmodeller project to the broader scientific community. Directly as a result of thie, TDWG seed funding was applied for and granted to hold a workshop at CRIA (Campinas, Brazil) in April. The purpose of the workshop is to evaluate possibilities for interoperability between various online services, with openmodeller to play a central role in this. 2.3 Other Contributions Various other contributions to the project were made over the course of the reporting period including: supporting the work of students (Danilo Bellini and Alexandre Jardim) in using the openmodeller library and the openmodeller project management tools; enhancements to the openmodeller Library including working on the removal of all compiler warnings, implementing support for writing to various new raster formats and various other improvements; carrying out the migration of the openmodeller source code management from CVS to SVN; documenting build procedures and other aspects of the project on the project wiki; collaborating with Renato De Giovanni on the specification of the openmodeller Web Service and writing a test client for this service; giving various presentations to monthly openmodeller project seminars; dealing with openmodeller related queries on the openmodeller users list; managing the bug and feature trackers; a training video was created that introduces users to the openmodeller Desktop user interface; promotion of openmodeller to third parties.
28 28 3 Figures Figure 1: High level view of the three tiered architecture of openmodeller Desktop. Only key classes for the openmodeller Desktop application are shown here.
29 29
30 30

31 31
32 32 Annex 04 FUNDAÇÃO DE AMPARO A PESQUISA DO ESTADO DE SÃO PAULO Relatório de Iniciação Científica Arcabouço para Distribuição e Modelagem de Espécies Uma Análise de Desempenho Bolsista: Mariana Ramos Franco Graduanda em Engenharia de Computação, Escola Politécnica da Universidade de São Paulo Orientador: Prof. Dr. Pedro Luiz Pizzigatti Corrêa Departamento de Engenharia de Computação e Sistemas Digitais,
33 33 Escola Politécnica da Universidade de São Paulo Número do Processo: 2006/ Ago/ Mar/2007
34 34 Resumo Balancear desenvolvimento social e econômico com conservação ambiental é um grande desafio. Existe uma grande demanda por ferramentas de software que determinem o nicho ecológico fundamental dos organismos. Tais ferramentas podem ajudar a compreender a ocorrência e distribuição das espécies biológicas, tal como aquelas em risco de extinção. O arcabouço openmodeller foi desenvolvido para fornecer o ambiente de software necessário para conduzir tais análises. O openmodeller é um sistema (open source) de modelagem de distribuição espacial de espécies. Os modelos são gerados através de um algoritmo que recebe como entrada um conjunto de pontos de ocorrência (latitude/longitude) e um conjunto de variáveis ambientais. Um dos diversos algoritmos pode ser usado para gerar o modelo e a projeção das probabilidades. Os algoritmos avaliam as circunstancias ambientais dos locais de ocorrência conhecidas da espécie, e computam o nicho ecológico perfeito. Para otimizar o desempenho do openmodeller foi conduzido um estudo cuidadoso das classes individuais e do fluxo de uma execução típica. Neste estudo a estrutura foi dividida em diversos componentes e uma carga típica foi definida com a ajuda dos usuários do sistema. Os resultados preliminares produzidos serão úteis para identificar os componentes que poderão ser processados de maneira paralela e distribuída. Estes resultados foram também usados para propor um modelo de análise de desempenho. O objetivo desse modelo é ajudar o desenvolvimento de uma infra-estrutura considerando desempenho, disponibilidade do sistema, interoperabilidade e custo financeiro. Palavras chaves: modelagem de espécies, análise de desempenho, arquitetura distribuída de alto desempenho, programação orientada a aspectos. Abstract Balancing social and economic development with environmental conservation is a major challenger. There is a strong demand for software applications to determine the fundamental ecological niche of organisms. Such tolls can help us to understand the occurrence and distribution of biological species, such as invasive or endangered species. The openmodeller framework was developed to provide a software environment for conducting such analyses. openmodeller is an open source static spatial distribution modeling framework. Models are generated by an algorithm that receives as input a set of occurrence points (latitude/longitude) and a set of environmental layer files. One
35 35 of several algorithms can be used to produce a model and generate a probability surface. The algorithms evaluate the environmental conditions at known occurrence sites and then compute the preferred ecological niche. For optimizing the performance of openmodeller it was conducted a careful study of individual classes and the typical execution flow chart. In this study the framework was divided into several components. A typical workload was defined with the help of end users. Preliminary results were produced that will be useful in identifying the components that can be processed in alternative parallel and distributed ways. These results were also used to propose a performance analysis model. The aim of the performance analysis model is to aid the development of an infrastructure that will deliver optimal performance, maximum system availability, interoperability and that minimizes financial costs. Keywords: Species distribution modeling, Performance evaluation, high performance and distributed application, Aspect Oriented Programming.
36 1 Sumário 1. Introdução 2 2. Objetivos Objetivos Gerais Objetivos Específicos 3 3. Revisão Bibliográfica Linguagens de Programação: C++/C# Framework.Net Paradigmas de Programação: OOP/ AOP Mecanismos para comunicação entre processos Visual Studio/ SQLServer Modelagem de Distribuição de Espécies Metodologias de Análise de Desempenho Técnicas de Análise de Desempenho: Teoria das Filas e Simulação Arena openmodeller: organização do código e suas classes Atividades Realizadas e Resultados Obtidos Uso de AOP para coleta de parâmetros de desempenho Levantamento dos componentes e de suas interfaces Wrapper em C# e portabilidade para o COM Arquitetura Implementada Modelo preliminar de simulação Publicação Conclusão Instituições Envolvidas Equipe do Projeto Bibliografia 34 Anexo 36 Assinaturas 37
37 2 Introdução Vários estudos têm sido realizados para identificar as regiões com maior risco de perda de biodiversidade no planeta. A identificação dessas áreas é importante para direcionar investimentos e esforços na conservação e proteção desses Biomas ameaçados. Para tanto, é necessário o desenvolvimento de processos que auxiliem o trabalho de produzir, trabalhar e usar a informação disponível (SIQUEIRA, 2005). Atualmente vêm sendo desenvolvidas e utilizadas várias técnicas de modelagem de distribuição geográfica de espécies que através de dados climáticos e espaciais, conseguem prever as áreas propícias ao desenvolvimento de determinadas espécies, utilizando algoritmos complexos como o GARP e o BIOCLIM (CANHOS et al., 2005). Através desses resultados é possível avaliar o impacto das mudanças climáticas na biodiversidade, identificar espécies que poderiam ser utilizadas em trabalhos de recuperação ambiental, avaliar o potencial de ameaça de espécies invasoras e auxiliar na determinação de áreas prioritárias para conservação (SIQUEIRA, 2005). Como essas técnicas de modelagem necessitam de uma grande quantidade de informações e de cálculos complexos, há uma demanda por ferramentas computacionais capazes de apresentar de forma simples e rápida a análise e visualização espacial desses dados, assim como para a construção de cenários de impacto e vulnerabilidade ambiental. Entre essas ferramentas computacionais podemos encontrar o sistema openmodeller (SOURCE FORGE, 2006). openmodeller é um sistema (open source) de modelagem de distribuição espacial de espécies desenvolvido inicialmente pelo CRIA (Centro de Referência em Informação Ambiental). Atualmente o CRIA, o INPE (Instituto de Pesquisas Espaciais) e a Escola Politécnica da USP vem desenvolvendo, com o apoio da Fapesp, um arcabouço para a modelagem e predição da distribuição de espécies biológicas, a partir da versão inicialmente disponível do openmodeller (CANHOS et al., 2005).
38 3 O sistema openmodeller faz uso intensivo de recursos computacionais para avaliar e apresentar o conhecimento presente em conjuntos de dados geográficos e de localização de espécies. Assim, tornou-se importante um estudo detalhado sobre a melhor maneira de configurar a distribuição de recursos computacionais de alto desempenho, tendo como principais parâmetros a disponibilidade do sistema, interoperabilidade e o custo financeiro. Através deste trabalho de iniciação científica foi possível realizar um estudo das funcionalidades de cada classe do sistema e do fluxo de uma execução típica, podendo-se assim dividir esse arcabouço em diversos componentes. Diversas cargas de trabalho foram utilizadas tornando possível levantar resultados que permitiam identificar os componentes passíveis de serem processados de forma paralela e distribuída e, deste modo, foi proposto um modelo de análise de desempenho que permite direcionar a preparação da arquitetura e infra-estrutura que suportará a solução. Objetivos Objetivos Gerais Analisar o desempenho da versão atual do openmodeller e propor uma configuração da arquitetura e infra-estrutura de alto desempenho do sistema, aderente aos requisitos do projeto, através da análise de desempenho de cada componente do arcabouço e da demandas de utilização de recursos computacionais. Objetivos Específicos - Geração de um ambiente dedicado a estudos e provas de conceitos, estudo de tecnologias, execução e instrumentação do arcabouço openmodeller;
39 4 - Identificação e documentação dos componentes e relacionamentos existentes entre eles, encontrados no sistema atual do openmodeller; -Levantamento de métricas de desempenho de cada componente tais como: volume e freqüência de dados manipulados pelos componentes, além do tempo de processamento dos componentes; - Definição de um modelo baseado na teoria de filas para simulação dos componentes (JAIN, 1999); - Estudo de tecnologias de desenvolvimento de software baseado em aspectos, assim como do ambiente de desenvolvimento de sistemas voltado para componentes (NATHAN, 2002). Revisão Bibliográfica A seguir, estão descritos os conceitos, as técnicas e ferramentas discutindo sua aplicação na pesquisa. Linguagens de Programação: C++/C# O código fonte do sistema em desenvolvimento do openmodeller utiliza a linguagem de programação C++ (ECKEL, 2003), além disso neste trabalho foi adotado C# (LIBERTY, 2005) na implementação dos wrappers, para facilitar a aquisição de métricas de desempenho. Assim neste item será feita uma breve apresentação para referenciar parte dos estudos realizados no aprendizado destas linguagens. C++ é uma linguagem de programação de alto nível (longe da linguagem de máquina, mais próxima da linguagem humana) com facilidades para o uso em baixo nível (mais próxima ao código de máquina), multiparadigma (estruturada ou orientada a objetos) e de uso geral. Deste os anos 90 é uma das linguagens de programação mais populares (ECKEL, 2003). C# ou CSharp é uma linguagem de programação orientada a objetos criada pela Microsoft, e atualmente faz parte da sua plataforma.net. Foi baseada em C++ e Java (LIBERTY, 2005).
40 5 Framework.Net Como ambiente de desenvolvimento foi utilizado o Microsoft.NET que é uma iniciativa da Microsoft que visa uma plataforma única para desenvolvimento e execução de sistemas e aplicações. Todo e qualquer código gerado para.net, pode ser executado em qualquer dispositivo ou plataforma que possua um framework: a "Plataforma.NET" (.NET Framework). Com idéia semelhante à plataforma Java, o programador deixa de escrever código para um sistema ou dispositivo específico, e passa a escrever para a plataforma.net (NATHAN, 2002). Paradigmas de Programação: OOP/ AOP A Programação Orientada a Objetos (Object Oriented Programing: OOP) (ECKEL, 2000) é um paradigma de análise, projeto e programação de sistemas de software baseado na composição e interação entre diversas unidades de software chamadas de objetos. A análise e projeto orientado a objetos têm como meta identificar o melhor conjunto de objetos para descrever um sistema de software. O funcionamento deste sistema se dá através do relacionamento e troca de mensagens entre estes objetos. Na programação orientada a objetos, implementa-se um conjunto de classes que definem os objetos presentes no sistema de software. Cada classe determina o comportamento (definidos nos métodos) e estados possíveis (atributos) de seus objetos, assim como o relacionamento com outros objetos. O sistema estudado foi todo desenvolvido procurando seguir o paradigma de orientação a objetos. Como citado no Item 2.1, parte dos objetivos específicos dessa pesquisa envolveu a geração de um ambiente dedicado a estudos e provas de conceitos, execução e instrumentação do arcabouço
41 6 openmodeller. Desse modo foi necessário implementar mecanismos para levantamento dos parâmetros de desempenho, porem sem interferir nas funcionalidades do sistema. Assim decidiu-se pelo uso da AOP (Aspect- Oriented Programming) como forma de desenvolver classes para coleta dos dados (RODKIN, 2004). Realizou-se então um estudo detalhado desse recente paradigma de programação. A Programação Orientada a Aspectos (Aspect-Oriented Programming: AOP) é um paradigma que permite aos desenvolvedores de software separar e organizar o código de acordo com a sua importância para a aplicação (separation of concerns). Todo programa escrito no paradigma orientado a objetos possui código que é alheio a implementação do comportamento do objeto. Este código é todo aquele utilizado para implementar funcionalidades secundárias e que encontra-se espalhado por toda a aplicação (crosscutting concern). A AOP permite que esse código seja encapsulado e modularizado (RODKIN, 2004). Os paradigmas de programação mais antigos, como a programação procedural e programação orientada a objeto, implementam a separação do código, através de entidades únicas. Por exemplo, a funcionalidade de log de dados, numa linguagem orientada a objetos, é implementada em uma única classe, que é referenciada em todos os pontos onde é necessário rastrear a execução. Como praticamente todo método necessita que alguns dados sejam registrados em log, as chamadas a essa classe são espalhadas por toda a aplicação. Tipicamente uma implementação da AOP busca encapsular essas chamadas através de uma nova construção chamada de "aspecto. Existem três conceitos importantes definidos na AOP: Joinpoints: são pontos bem definidos ao longo da execução do programa, podem ser, por exemplo: chamadas de métodos, acessos a membros de uma classe, criação de objetos. Pointcuts: construção de linguagem que junta um conjunto de joinpoints baseando-se em um critério pré-definido.
42 Advice: é o trecho de código que é executado antes, depois ou simultaneamente a um joinpoint. 7 Um aspecto pode alterar o comportamento de um código (a parte do programa não orientada a aspecto) pela aplicação de comportamento adicional, advice, sobre um "ponto de execução", ou join point. A descrição lógica de um conjunto de join points é chamada de pointcut. A utilização da AOP foi a forma encontrada para fazer a coleta das métricas de desempenho sem que isso interferisse nos dados coletados. Mecanismos para comunicação entre processos Neste item são apresentados mecanismos que permitem a comunicação entre processos (programas em execução) considerados nesta pesquisa: RPC, DCOM/COM+ e MSMQ. RPC A Chamada de Procedimento Remoto ou RPC (Remote Procedure Call) é um protocolo para chamada remota de procedimentos para a transferência de controle de parte de um processo para outro. O protocolo RPC pode ser implementado sobre diferentes protocolos de transporte (TANENBAUM, 2002). DCOM DCOM (Distributed component object model) é uma tecnologia proprietária da Microsoft para criação de componentes de software distribuídos em computadores interligados em rede. O DCOM é uma extensão do COM (também da Microsoft) para a comunicação entre objetos em sistemas distribuídos (TANENBAUM, 2002). DCOM substitui a comunicação local entre processos por um protocolo de rede (semelhante ao RPC). Tratando detalhes de baixo nível de
43 8 protocolos de rede enquanto o desenvolvedor preocupa-se somente em implementar aspectos funcionais da aplicação. COM+ Criado pela Microsoft, o COM+ (Component Object Model) é uma plataforma independente, distribuída e orientada a objeto para a criação de componentes de software que possam interagir num sistema distribuído, especificando um padrão binário que define como os objetos podem interagir (NATHAN, 2002). Através do COM+ os componentes do framework foram distribuídos para a realização da análise de desempenho do mesmo. MSMQ O MSMQ (Microsoft Message Queuing) é essencialmente um protocolo de dados que permite aplicativos rodando em diferentes servidores se comunicarem. Assegura a entrega de confiança colocando as mensagens que não alcançam seu destino pretendido em uma fila e então as reenviando quando o destino estiver disponível. Isto permite comunicação entre diferentes redes e computadores que nem sempre podem ser conectados (MESSAGE QUEUING, 2007). Suporta também transações e permite operações múltiplas em filas múltiplas, co todas as operações envolvidas em uma única transação. Visual Studio/ SQLServer O Microsoft Visual Studio (DEVELOPER CENTER, 2007) é a plataforma de desenvolvimento adotada nesta pesquisa como ambiente de desenvolvimento para estudo do openmodeller, pois permite a utilização dos mecanismos de comunicação entre processos utilizado: DCOM/COM+, empregados no desenvolvimento dos wrappers. O Microsoft Visual Studio é um conjunto de ferramentas integradas para
44 desenvolvimento de software, especialmente dedicado ao framework.net e as linguagens de programação Visual Basic (VB), C, C++, C# e J#. 9 O SQL Server (SQL SERVER 2005 HOME, 2007) é um gerenciador de banco de dados relacional feito pela Microsoft. É um banco de dados muito robusto e usado muito em empresas e por grandes sistemas corporativos. Atualmente encontra-se na versão Entre os recursos está a integração com o Framework.Net, que possibilita construir rotinas utilizando as linguagens do.net como VB e C#. Por esses motivos e pela facilidade de utilização junto com o Visual Studio, foi o sistema de banco de dados escolhido para armazenar as métricas de desempenho obtidas. Modelagem de Distribuição de Espécies Para entender o funcionamento do sistema openmodeller foi preciso aprender sobre os procedimentos realizados na modelagem de distribuição de espécies e sua importância. Isso foi possível através da leitura de artigos acadêmicos sobre o assunto (SIQUEIRA, 2005) e também através do contado com pesquisadores do CRIA que trabalham com esse tipo de modelagem. Foi realizado também um estudo sobre os algoritmos de modelagem disponíveis no openmodeller:
45 10 Bioclim: Para cada variável ambiental dada, o algoritmo acha o desvio médio e padrão (presumida distribuição normal) associado ao ponto de ocorrência. Neste modelo, os pontos podem ser classificados como: Apropriados: se todos os valores ambientais associados caírem dentro do intervalo calculado; Marginal: se um ou mais valores ambientais caírem fora do intervalo, mas ainda dentro dos limites superiores e inferiores. Inadequado: se um ou mais valores ambientais caírem for a dos limites superiores e inferiores. A saída determinada pelo Bioclim é mapeada para as probabilidades de 1.0, 0.5 e de 0.0 respectivamente. Bioclim Distance: A especificação do Bioclim original define três regiões: apropriado, marginal e inadequado. A região apropriada relacionase ao intervalo mencionado antes, e é a única região considerada nesta execução (isto é, pontos com queda dentro de marginal ou inadequado têm probabilidade 0 aqui). A probabilidade de presença para pontos dentro da região apropriada é inversamente proporcional à distância e euclidiana normalizada entre um ponto e o ponto médio. Climate Space Model: O Climate Space Model (CSM) é a princípio baseado em componentes. O processo de seleção dos componentes neste algoritmo considera que todo componente abaixo do valor médio (média de uma amostra randômica) é rejeitado. Distance to Average: Normaliza os valores ambientais e os parâmetros (de acordo com o número de variáveis ambientais). Calcula o ponto médio no espaço ambiental que considera todos os pontos da presença. Ao projetar o resultado, calcula a distância euclidiana entre o ponto
46 11 médio e cada ponto no espaço ambiental. Se a distância dist estiver em [0, MAXDIST] então a probabilidade da ocorrência estará em [1, 0]. Se dist > MAXDIST então a probabilidade será zero, onde MAXDIST é um dos parâmetros a serem passados para o algoritmo. Genetic Algorithm for Rule-set Production (GARP): GARP é um algoritmo genético que cria modelos de nicho ecológicos para espécies. Os modelos descrevem as circunstâncias ambientais em que a espécie deve poder manter populações. Como entrada, GARP usa um conjunto de pontos de localização onde é conhecida a ocorrência da espécie e um conjunto de camadas geográficas que representam os parâmetros ambientais que podem limitar as potencialidades de sobrevivência da espécie. Minimum Distance: Normaliza os valores ambientais das variáveis e o parâmetro (de acordo com o número de variáveis ambientais). Calcula a distância entre as circunstâncias ambientais dadas a cada ponto de ocorrência e seleciona a distância mais próxima. Se a distância ' dist ' estiver dentro de [ 0, MaxDist ] então a probabilidade estará dentro de [ 0.1 ]. Se ' o dist ' > MaxDist então a probabilidade será zero. Metodologias de Análise de Desempenho Para a realização da análise de desempenho foi estudada uma metodologia (BRESSAN, 2003), que contribuiu para que não ocorressem enganos durante o processo de análise e para guiar o andamento dos trabalhos. Os passos da metodologia adotada foram os seguintes: - Definição dos objetivos e planejamento da análise: definição clara dos objetivos e dimensionamento do sistema, configuração do sistema a ser
47 12 analisado, cronograma para realização do estudo e os recursos necessários. - Definição do sistema: determinar as características a serem analisadas e as fronteiras que delimitam o sistema. - Enumeração dos serviços e resultados do sistema: identificar objetivos, serviços realizados e resultados esperados. - Seleção de métricas de desempenho: determinar as formas de medir o desempenho do sistema. - Enumeração dos parâmetros da análise: coleta dos dados para determinação dos parâmetros. - Seleção dos fatores a serem estudados: entre os parâmetros identificados, serão selecionados aqueles que tem maior impacto no desempenho e que serão variados na análise. - Seleção da carga de trabalho: projeção da carga a ser submetida ao sistema, considerando a carga típica e em momentos de pico. - Definição do modelo conceitual de sistema: especificar a concepção que se tem do sistema e tudo o que foi assumido. - Seleção da técnica de modelagem: escolha das ferramentas a serem utilizadas na análise. - Realização da modelagem: planejamento e execução dos experimentos. - Definição e projeto dos experimentos: escolher os diversos níveis (ou valores) dos fatores que afetam o desempenho do sistema, entre os quais a carga a ser submetida e aqueles que determinam características do sistema. - Validação do modelo: revisão do modelo para verificar se os resultados estão corretos e dentro do esperado.
48 13 - Execução dos experimentos: realização dos experimentos com o modelo desenvolvido e validado utilizando os níveis de carga escolhidos. - Análise e interpretação dos resultados: verificação estatística para a correta interpretação dos resultados. - Documentação e apresentação dos resultados: deverá ser documentado o modelo conceitual do sistema e tudo o que foi assumido em termos de parâmetros e fatores, assim como os resultados obtidos e suas análises. Técnicas de Análise de Desempenho: Teoria das Filas e Simulação Também foi necessário o estudo de modelos de simulação de sistemas computacionais para que fosse possível determinar um modelo adequado para a realização da análise de desempenho do sistema, de forma que se obtivessem resultados condizentes com a realidade. A Teoria das Filas e a Teoria da Simulação de Sistemas (JAIN, 1999) são técnicas utilizadas para planejamento que permitem a modelagem e a simulação de um sistema computacional. Elas constituem a base teórica de modelos de sistemas computacionais, relacionados com simulação e foram utilizadas para a construção do modelo de componentes do openmodeller. A Teoria das Filas é um método analítico de que aborda o assunto por meio de fórmulas matemáticas. Já a Simulação é uma técnica que, usando o computador digital, procura montar um modelo que melhor represente o sistema em estudo. Arena O Arena é um software de simulação que utiliza um conjunto de blocos (ou módulos) para descrever uma aplicação real. Estes blocos funcionam como comandos de uma linguagem (else, if, while...) facilitando em muito a programação (PRADO, 2004).
49 Através do Arena é possível simular o funcionamento do modelo de filas criado para o framework openmodeller. 14 openmodeller: organização do código e suas classes Foi realizado o estudo do código em C++ da versão de 14/12/2005 disponibilizada em: Pela falta de documentação e pela complexidade do sistema não é de fácil percepção o seu funcionamento, mas através de um estudo detalhado foi possível entender a organização do código e o seu funcionamento apresentado a seguir. O funcionamento do openmodeller segue os mesmos passos que uma modelagem de nicho ecológico comum que para realizar a distribuição de espécies, utiliza pontos de ocorrência de uma espécie em uma determinada região e a soma das variáveis ambientais desses pontos (como temperatura ou índice pluviométrico) para gerar um modelo de distribuição. Em uma segunda etapa, esse modelo é projetado em qualquer região geográfica contendo os mesmos tipos de variáveis ambientais, com o objetivo de se obter a probabilidade de ocorrência da espécie na região. Para realizar a modelagem de nicho, o pesquisador deve seguir os seguintes passos: Ter um arquivo com pontos de ocorrência da espécie e mapas georeferenciados com as variáveis ambientais relevantes (definido a critério do pesquisador); Escolher um algoritmo adequado para o cálculo do modelo e para a projeção (sempre deve ser o mesmo algoritmo) e os parâmetros de ajuste desse algoritmo;
50 15 Figura 1. Passos para a modelagem. O resultado da projeção é uma imagem em formato TIF em escala de cinza geoferenciada contendo a probabilidade de distribuição da espécie e a impressão de estatísticas relacionadas, como acuidade do modelo e porcentagem de ocupação da espécie na área. Levando em conta a arquitetura e organização das classes do openmodeller, foi possível descrever os seguintes itens: Arquivos de entrada: arquivo texto de ocorrência de espécie, mapas georeferenciados utilizados para configurar as variáveis ambientais, mapa para a projeção do modelo e arquivo de configuração do sistema; Biblioteca openmodeller: biblioteca para processamento de entrada e saída, geração de modelo e projeção de distribuição de espécie; Algoritmos: cada algoritmo é constituído de um componente próprio que pode ser removido ou adicionado ao sistema, basta implementar uma estrutura de classes pré-definida. Ex: GARP, BIOCLIM, Minimum Distance. Arquivos de saída: Arquivo TIF em escala de cinza e georeferenciado representado a probabilidade de ocorrência da espécie naquela área; Bibliotecas auxiliares: bibliotecas open-source utilizadas como componentes, elas são: o GDAL: Manipulação de imagens rasterizadas e georeferenciadas; o EXPAT: Manipulação de arquivos XML o GSL: Biblioteca matemática utilizada no algoritmo BioClim.
51 16 Figura 2. Arquitetura do openmodeller O processo do trabalho do openmodeller pode ser entendido também através da organização das entidades que compõe o sistema, conforme descrito á baixo: Entrada de dados: os pontos de ocorrência de uma espécie estão representados através das classes Occurrance e Occurrances, as variáveis ambientais são representadas pela classe Environment, que reúne uma coleção de mapas georeferenciados. Os parâmetros de configuração das classes Algorithm e AlgorithmMetaData servem para instanciar o algoritmo escolhido com os parâmetros necessários; Geração de modelo: A classe openmodeller é responsável por configurar a classe Algorithm com as ocorrências e as varáveis ambientais e por controlar a execução do algoritmo até que o modelo Projeção da distribuição de espécie: A classe Projector recebe o modelo através de um objeto Model, o mapa de saída no objeto Map e as variáveis ambientais através do objeto Environment. Com isso, para
52 17 cada valor de latitude e longitude do mapa de saída, ela chama o modelo para calcular a probabilidade de ocorrência da espécie naquele ponto. Cálculo estatístico: Cada probabilidade calculada durante a projeção é armazenada na classe AreaStats, que juntamente com a classe MatrixConfusion, calcula as consolidadas do processo de projeção. Portanto o funcionamento do openmodeller apresenta dois processos principais: modelagem e projeção. a. Processo de modelagem A criação do modelo de distribuição se dá através da função CreateModel da classe Algorithm. Como já mencionado, o openmodeller suporta vários algoritmos. A função CreateModel na verdade chama várias funções genéricas que são implementadas em uma DLL (Dynamic Link Library) para cada um dos algoritmos suportados. Um único algoritmo é utilizado a cada execução: ele é selecionado a partir da leitura do arquivo request.txt que é responsável pela configuração da modelagem. b. Processo de projeção Toda a projeção é feita pelo método createmap da classe Projector que recebe como entrada o modelo e as variáveis ambientais de saída e gera a projeção em um mapa de saída, guardando também a estatísticas pertinentes. Assim podemos dividir os parâmetros do método em duas partes: Parâmetros de entrada: o Environment: Classe que contém as variáveis que representam o ambiente onde a espécie irá ser projetada, cada variável é representada pela classe Layer (Camada) e cada camada têm uma classe Map representando um mapa rasterizado e georeferenciado;
53 18 o Model: Classe que representa o modelo matemático de distribuição de espécies, esse modelo contém uma média para cada ponto de ocorrência da espécie e será utilizado para calcular a probabilidade de ocorrência da espécie; Parâmetros de saída: o Map: Classe que representa o mapa onde a espécie será projetada, ele encapsula uma imagem rasterizada e georeferênciada, representada por classes da API GDAL; o AreaStats: Guarda as probabilidades de ocorrência da espécie e gera uma estatística unificada de pontos e probabilidade de ocorrência; A projeção do openmodeller é basicamente um laço, onde para cada píxel, uma probabilidade é calculada baseada nas variáveis de projeção, e escrita em um mapa de saída. É importante ressaltar aqui, que durante a projeção, o openmodeller ainda referência o algoritmo, isso faz com que o desempenho da projeção esteja diretamente ligada ao desempenho do algoritmo, implicando que as técnicas de paralelismo aplicadas na projeção devem levar em conta esse fator. Atividades Realizadas e Resultados Obtidos Uso de AOP para coleta de parâmetros de desempenho. Através da AOP é possível interceptar um método de uma instância, e assim conseguir o seu tempo total de execução. Além disso, é possível obter outras métricas de utilização de recursos (como uso de CPU e memória) através da API WMI encontrada no Framework.NET. A AOP foi desenvolvida para capturar os interesses comuns do sistema (concerns) que não são capturados pelas técnicas de programação tradicionais, como a OOP (Programação Orientada a Objetos). Um concern é um objeto, um conceito ou uma área de interesse.
54 19 Quando afeta múltiplos módulos de execução de um programa, chamamos de crosscut. AOP apresenta uma maneira de colocar o código destes crosscuts em um único lugar (por exemplo, uma única classe especializada). Nesta pesquisa, foi usado um advice após cada método de cada componente. Desta maneira, pudemos ajustar um contador à zero antes da execução de algum método, iniciar o contador e parar a contagem com o retorno do método, atribuindo o resultado a uma variável e chamando um método específico no aspect. Um aspect é um recipiente para todos os pointcuts e advices que executam um único crosscut; pode geralmente ser definido como uma classe, podendo ter métodos e campos além dos pointcuts e advice. Deste modo, para colher as métricas de desempenho, seria necessário apenas a criação de uma classe em AOP para interceptar os vários métodos presentes nas diversas classes do openmodeller. Em adição as métricas de tempo, a técnica de AOP usa a API WMI (Windows Management Instrumentation) para capturar outras métricas e estatísticas, como utilização de memória e processador, já que esta fornece acesso consistente às informações dentro de uma aplicação, possibilitando a descoberta da relação entre os componentes. Levantamento dos componentes e de suas interfaces. Através da organização do código do openmodeller podemos verificar a seguinte separação em componentes: libopenmodeller_dll: biblioteca com as classes utilizadas para obtenção dos parâmetros de entrada, geração do modelo e projeção; om_create: responsável por iniciar a criação do modelo de distribuição; om_project: através do modelo cria a projeção em uma mapa em escala de cinza;
55 20 algoritmos: implementam formas diferentes de cálculo estatístico para criação do modelo e da projeção (ex: Bioclim, GARP, Minimum Distance). Figura 3. openmodeller e seus componentes Como cada algoritmo consiste em um componente próprio, podendo ser removido ou adicionado ao sistema bastando implementar uma estrutura de classes pré-definida. Com isso o sistema permite que diferentes algoritmos usem os mesmos dados de entrada e o mesmo ambiente de funcionamento, possibilitando comparação entre resultados.
56 21 Figura 4. Algoritmos plugáveis A classe que implementa o algoritmo deve apresentar em sua estrutura os seguintes requisitos para poder fazer parte do framework: Especificação dos metadados: através das constantes parameters e metadata que mantêm as informações (metadados) sobre os parâmetros a serem utilizados e sobre o próprio algoritmo; Método para inicialização: initialize(), responsável por verificar a validade dos parâmetros contidos nas classes Algorithm e AlgorithmMetaData, e por carregar os pontos de ocorrência e as variáveis ambientais armazenados nas classes Occurrance e Environment respectivamente; Métodos para geração do modelo; Método para cálculo da probabilidade. Na construção do modelo o openmodeller passa para o algoritmo os valores das variáveis ambientais para cada ponto de ocorrência da espécie à ser analisada (ex: 20 e 115mm de chuva ver Figura 5). O modelo é gerado e apresentado através da classe Model e um arquivo.xml é criado com os resultados do modelo.
57 22 Figura 5. Construção do modelo Na projeção o openmodeller pergunta ao algoritmo a probabilidade de ocorrência da espécie para cada variável ambiente do mapa de projeção. Essas probabilidades são então armazenadas na classe AreaStats. Figura 6. Geração da projeção Cada algoritmo é implementado em uma DLL. O openmodeller busca todas as DLLs disponibilizadas e as carrega ao sistema. A comunicação com o algoritmo selecionado através do arquivo de entrada é, então, realizada através de dois métodos públicos do algoritmo, são eles: algorithmfactory(): retorna um objeto da classe que implementa o algoritmo; algorithmmetadata(): devolve os metadados sobre o algoritmo; Esses dois métodos servem de interface entre a biblioteca libopenmodeller_dll, responsável pela lógica de negócio do sistema, e os algoritmos.
58 23 Wrapper em C# e portabilidade para o COM+. Um dos principais problemas em avaliar o desempenho de uma aplicação monolítica como o openmodeller é predizer o desempenho de cada método à fim de identificar os gargalos. Para tentar resolver esse problema decidiu-se dividir a aplicação em componentes funcionais diferentes (já citados no item anterior) e hospedar então estes componentes em uma arquitetura distribuída que execute uma comunicação inter processos entre o processo principal e todos os componentes. Assim escolheu-se hospedar os componentes usando a arquitetura de middleware do Microsoft COM+ (Component Object Model). O objetivo do COM+ é suportar o desenvolvimento de componentes que possam ser ativados dinamicamente e interagir entre si (TANENBAUM, 2002). O próprio COM+ é oferecido na forma de uma biblioteca que é ligada a um processo especializado para aceitar um volume elevado de chamadas inter-processos. Assim, do próprio programa principal, todos os componentes são chamados de uma maneira distribuída, independentemente de sua localização. Esta tecnologia, além de ser uma plataforma de middleware orientada a objetos para comunicação interprocessos, fornece funcionalidades ricas. Por exemplo, o COM+ apresenta o mecanismo de interception que é essencial para implementar o paradigma da AOP necessário para instrumentar o código dos componentes do openmodeller. Para transformar em componentes COM+ foi necessário criar um wrapper (casca) em C# para cada componentes já que o COM+ não suporta DLLs geradas a partir de código em C++ puro, como ocorre no caso do openmodeller. Assim foi criada uma classe em C# para cada componente, que chama os métodos públicos do componente.
59 24 public class OM_BIOCLIM:ServicedComponent { [DllImport ( om_bioclim.dll )] static extern System.IntPtr algorithmmetadata( ); [DllImport ( om_bioclim.dll )] static extern System.IntPtr algorithmfactory( ); public System.IntPtr algorithmmetadatanet( ){ } return algorithmmetadata( ); public System.IntPtr algorithmfactorynet( ){ return algorithmfactory( ); } } Figura 7. Exemplo de wrapper em C# Na Figura 7 é apresentado um exemplo de wrapper implementado para referenciar o componente om_blioclim. Como este componente é um dos algoritmos plugáveis (responsáveis pelos métodos de calculo estatístico para geração do modelo e projeção) existem apenas dois métodos públicos algoritmmetadata() e algorithmfactory(), assim foi necessário criar apenas dois métodos em C# para referenciá-los: algorithmmetadatanet() e algorithmfactorynet(). Essas classes em C# foram então encapsuladas em COM+ para que se pudesse realizar através da AOP o interception de cada método de cada componente, ficando assim o sistema de maneira distribuída.
60 25 Figura 8. Componentes distribuídos no COM+ Arquitetura Implementada Para coletar as métricas de desempenho do framework openmodeller foi especificada uma arquitetura, procurando minimizar o impacto da instrumentação do código sobre as métricas coletadas. Deste modo, foi criado uma classe utilizando AOP para interceptar os métodos dos componentes do openmodeller portados para o COM+. Na classe de AOP, um método foi criado para gerar uma mensagem com a informação sobre o tempo de execução do método pertencente a algum componente COM+. Este método também instancia o WMI que monitora o consumo dos recursos computacionais. Outro método da classe de AOP é responsável por colocar a mensagem gerada numa fila de mensagens assíncronas através do Microsoft Message Queue (MSMQ). Outro processo é responsável por monitorar a fila do MSMQ,
61 26 capturar a mensagens e as persistir no banco de dados. Em paralelo com essa execução, o openmodeller continua processando normalmente, já que as execuções da classe de AOP são chamadas num processo separado. Um aplicativo chamado de LogService foi desenvolvido para rastrear as mensagens armazenadas em um a fila do MSMQ e para persistir numa base de dados para análise. O serviço processa continuamente a fila de mensagens, recolhendo-as em intervalos de 5 minutos. Esse intervalo pode ser configurado num arquivo XML. Assim, as mensagens geradas pela instrumentação de AOP são armazenadas na fila e permanecem lá enquanto o serviço é processado e as mensagens persistidas. Para evitar a disputa por recursos computacionais entre o processo do openmodeller e o processo de coleta de métricas de desempenho, este último foi configurado para funcionar com menor prioridade do que o sistema openmodeller. A ilustração seguinte mostra o fluxo de trabalho da arquitetura implementada para permitir o recolhimento das evidências relacionadas ao processo de avaliação de desempenho. Para uma compreensão melhor do processo inteiro, uma breve explicação de cada estágio é fornecida abaixo.
62 27 Figura 9. A arquitetura e infra-estrutura projetados para o processo da avaliação de desempenho do openmodeller. O processo de avaliação de desempenho consiste de 5 estágios, descritos a seguir: 1. O usuário submete os dados de entrada ao componente principal do openmodeller. 2. Esse componente principal, uma aplicação do console, invoca os componentes instalados no COM+, para construir o modelo e projeção. Como os componentes processam os dados de entrada fornecidos pelo usuário, estes componentes retornam o status do progresso da computação. O status é apresentado ao usuário em sua tela. 3. Cada método dos componentes hospedados no COM+ é interceptado e cada crosscut é criado pelo mecanismo de AOP em um processo diferente. As execuções da classe de AOP coletam as métricas e sincronizam-se com o WMI. Uma
63 28 mensagem é gerada com as evidências e emitida ao MSMQ para ser armazenada em uma fila. 4. O LogService, processa a fila de acordo com a configuração especificada e recupera as mensagens que foram armazenadas. Esse processamento é executado sempre na prioridade baixa, para evitar a interferência do processo de avaliação e para evitar o uso de recursos computacionais em excesso. 5. O processo continua executando e coletando as mensagens por tempo especificado na configuração. Depois desse tempo terminar, o LogService envia essas mensagens para o sistema de banco de dados para serem persistidas numa tabela apropriada. Depois de todas as mensagens salvas no banco, o LogService volta ao estado inativo. Modelo preliminar de simulação. A idéia principal deste modelo é permitir a simulação do sistema e analisar o seu desempenho através de uma infra-estrutura diferente de componentes; sendo uma importante ferramenta para a decisão de uma melhor distribuição dos componentes do openmodeller e para identificar os gargalos possíveis do sistema. Analisando os dados coletados e a implementação atual do openmodeller foi possível pensar numa arquitetura distribuída que fizesse o sistema mais eficiente. Nessa arquitetura, o usuário não precisa instalar todo o openmodeller, com a lib_openmodeller e bibliotecas auxiliares, a fim de construir e projetar o modelo. Somente a relação de usuário e um componente simples analisariam e verificariam a consistência dos argumentos necessários. Este componente simples também submeteria os dados de entrada necessários ao openmodeller, que é agora um serviço remoto, hospedado em uma infra-estrutura dedicada. Esta infraestrutura forneceria recursos computacionais mais poderosos do que os encontrados num computador pessoal comum.

64 29 Nessa arquitetura remota, são propostas duas camadas. A primeira camada consiste em um Web Server e um componente responsável por decidir qual componente do sistema deve ser invocado. Nesta camada ficariam também os serviços de segurança como autenticação e autorização, dependendo do escopo. A segunda camada consistiria do núcleo do openmodeller (lib_openmodeller) e dos componentes responsáveis por implementar os diferentes algoritmos de modelagem. Figura 10. Arquitetura sugerida. Baseada nessa arquitetura, foi criado na ferramenta de simulação Arena um modelo de filas para que junto com os dados coletados de desempenho da versão atual do openmodeller seja possível simular e validar a arquitetura proposta.
65 30 Figura 11. Respresentação do modelo de simulação do sistema openmodeller. Publicação. Também foi submetido e publicado um artigo na Conferência 5th International Conference on Ecological Informatics ISEI ( conference.elsevier.com), organizado pela Elsevier em associação com a International Society for Ecological Informatics (ISEI), na cidade de Santa Bárbara CA, EUA. A ISEI tem por objetivo promover os conceitos relacionados à Informática Ecológica, organizando conferências internacionais bianuais, divulgando informações através de site na WEB e publicações no Journal Ecologial Informatics. A ISEI pretende facilitar a formação de uma rede especializada de grupos de pesquisa, interdisciplinar em processamento de informação em ecossistemas, computação inspirada em biologia, visualização e gerenciamento de dados, bem como educação e treinamento em informática orientada em ecologia. A participação na 5th International Conference on Ecological Informatics ISEI, envolveu a apresentação oral do trabalho do aluno de Doutorado Jéferson Araújo, citado a seguir: ARAÚJO, J.M., CORRÊA, P.L.P., FRANCO, M. R., SARAIVA, A. M. A Framework For Species Distribution Modeling- A performance evaluation approach. In: 5th International Conference on Ecological Informatics ISEI, 04-06
66 31 December 2006 Santa Barbara, CA. Apresentado por Jeferson Martin de Araújo. O resumo desse trabalho foi publicado nos anais do 5th International Conference on Ecological Informatics ISEI. O artigo completo foi submetido para publicação numa edição especial em 2007 do Journal Ecologial Informatics (ANEXO), sendo que o resultado dos artigos selecionados será divulgado até o final do primeiro semestre de Conclusão Em resumo o trabalho de pesquisa teve o objetivo de analisar o sistema openmodeller atual e sugerir uma arquitetura distribuída de alto desempenho para o mesmo. Para isso foi criada uma infra-estrutura para coleta de métrica de desempenho, utilizando então AOP para que não houvesse impacto da infra-estrutura sobre os dados coletados. Uma arquitetura distribuída foi proposta para a implementação do Framework openmodeller, onde este estaria disponível através de Web Service e seus componentes em servidores de alto desempenho. É sugerido como continuidade desse trabalho uma análise das métricas coletadas para identificação dos gargalos e dos componentes passíveis de paralelização Além disso, com a análise dessas evidências será possível levantar a curva de distribuição do desempenho de cada componente pela carga aplicada ao sistema e assim realizar as simulações através do modelo de filas para verificar o comportamento da arquitetura proposta. A apresentação do trabalho numa conferência sobre informática ecológica mostra a importância dessa pesquisa não só para o projeto openmodeller, mas também para outros projetos ligados à ecologia, que muitas vezes fazem uso de uma grande quantidade de recursos computacionais, como o projeto financiado pela NSF (National Science Foundation EUA) denominado SEEK (Science Environment for Ecological Knowledge) (PARTNERSHIP FOR BIODIVERSITY INFORMATICS, 2004). Esse mesmo trabalho realizado para o openmodeller poderia ser realizado para outros sistemas, afim de obter um ganho de desempenho dessas aplicações.
67 32 Instituições Envolvidas As instituições envolvidas no desenvolvimento do arcabouço openmodeller são: CRIA (Centro de Referência em Informação Ambiental). Trabalha com sistemas de informação de biodiversidade e está responsável pelo desenvolvimento e por disponibilizar o arcabouço na Internet, além de integrar os dados sobre as espécies com a ferramenta. INPE (Instituto de Pesquisas Espaciais) Trabalha com pesquisa científica e aplicações tecnológicas em ciências atmosféricas. Neste projeto é responsável por integrar o openmodeller a um Sistema de Informação Geográfico (SIG), denominado Terralib. Escola Politécnica da USP Trabalha com pesquisa e ensino e está responsável por executar estudos que serão importantes para a implementação e aperfeiçoamento do openmodeller, tais como a sua distribuição computacional através da web, o processamento computacional paralelo, desenvolvimento de novos algoritmos para modelagem, além da definição dos padrões e protocolos a serem utilizados. FAPESP (Fundação de Amparo à Pesquisa do Estado de São Paulo) Instituição financiadora do projeto.
68 33 Equipe do Projeto Mariana Ramos Franco Aluna de Graduação da Escola Politécnica da USP em Engenharia de Computação. Prof. Dr. Pedro Luiz Pizzigatti Corrêa Orientador do projeto. Prof. Dr. Antonio Mauro Saraiva Coordenador do grupo do openmodeller na Escola Politécnica da USP e co-orientador do projeto. Profa. Dra. Liria Sato Responsável pela infra-estrutura de grid/cluster do projeto. Jeferson Martin de Araújo Pesquisador do Laboratório de Automação Agrícola da Escola Politécnica da USP, na área de pesquisa relacionada à Modelagem e Análise de Desempenho de Sistemas Computacionais.
69 34 Bibliografia BRESSAN, G. Abordagem Sistemática de Modelagem e Análise de Desempenho. LARC-PCS/EPUSP, 2003 CANHOS, V. et al. A framework for species distribution modeling. Projeto de Pesquisa CRIA, Escola Politécnica da USP e INPE. São Paulo, INCUBADORA. Portal da Fapesp sobre o Projeto OpenModeller: Disponível em:< Acesso em 18 de maio de JAIN, R., The Art of Computer Systems Performance Analysis, John Wiley & Sons Inc, ISBN: , 1991, 685 p. LAW, A. M., KELTON, W. D., Simulation Modeling and Analysis, 3rd ed.,mcgraw- Hill Companies Inc, MENASCÉ, D. A., ALMEIDA, V. A. F., Scaling E-Business: Technologies, Models,Performance and Capacity Planning, Prentice-Hall, NATHAN, Adam..NET and COM The Complete Interoperability Guide. SAMS, Fisrt Edition PRESSMAN, Roger S. Engenharia de Software. Mc Graw Hill, 5ª ED., RODKIN, R.; LADDAD, R. Zen and the Art of Aspect-Oriented Programming. Linux Magazine, abril, SINHA, Pradeep K. Distributed Operating Systems Concepts and Design. IEEE Computer Society Press, First Edition SIQUEIRA, M. F. Uso de modelagem de nicho fundamental na avaliação do padrão de distribuição geográfica de espécies vegetais. Tese de doutorado. Departamento de Engenharia Ambiental da Universidade de São Carlos. São Carlos, São Paulo, SOURCE FORGE. Portal do Projeto OpenModeller. Disponível em: < Acesso em 25 maio de 2006.
70 35 TANENBAUM, A. S. Computer networks. Prentice Hall PTR, 4th Edition TANENBAUM, A. S.; STEEN, Maarten van. Distributed Systems Principles and Paradigms. Prentice Hall, First edition ECKEL, B; ALLISON, C. Thinking in C++, Vol. 2: Practical Programming. 2 nd Edition. Prentice Hall PTR, November, LIBERTY, J. Programming C#. O Reilly Media; 4 th Edition. February, LOWY, J. COM+ e.net. Editora Campus, PRADO, D. Usando o Arena em Simulação, Vol 3. INDG Tecnologia e Serviços Ltda PARTNERSHIP FOR BIODIVERSITY INFORMATICS. SEEK -Science Environment for Ecological Knowledge, 2004 Disponível em: < Acesso em 06 de novembro de ECKEL, B. Thinking in C++, 2 nd Edition, Volume 1. Prentice Hall. April, MESSAGE QUEUING Microsoft s official page about MSMQ. Disponível em: < spx>. Acessado em 08 de fevereiro de DEVELOPER CENTER Visual Studio. Disponível em: < Acessado em 08 de março de SQL SERVER 2005 HOME Microsoft SQL Server. Disponível em: < Acessado em 08 de março de 2007.
71 36 Anexo ARTIGO A Framework for Species Distribution Modelling: A performance evaluation approach
72 37 Assinaturas Bolsista: Mariana Ramos Franco Orientador: Prof. Dr. Pedro Luiz Pizzigatti Corrêa São Paulo, 09 de março de 2007.
73 38 Annex 05 OpenModeller How to insert an algorithm by Danilo J. S. Bellini Thursday, 22 / September / 2006
74 39 Working environment This study was done in a Acer Aspire 3004WLCi laptop running Kubuntu Linux 3.03 (Kernel ). This manual is made for developers who want to create a new algorithm in openmodeller, and suppose that you already have installed it from scratch. This is the source dir for all openmodeller parts (except the GUI): ~/dev/cpp/om/src For the algorithms, all files are in: ~/dev/cpp/om/src/algorithms All openmodeller (om) main data structures classes are in: ~/dev/cpp/om/src/openmodeller The root directory for om, where you have autogen.sh configurator and the root Makefile: ~/dev/cpp/om/ How to compile with om Makefile changes If we want to add a new algorithm, so we need to understand what happens in the algorithms' directory. A file named Makefile.am have a source to a makefile generator, and inside of it we can see something like: SUBDIRS = garp dg_garp best_subsets OMSRCDIR OMLIB = $(OMSRCDIR)/openmodeller/libopenmodeller.la plugindir = ${libdir}/openmodeller SUBDIRS have the name of all subdirectories inside algorithms directory we have another Makefile to be opened. It's useful when we have huge algorithms. The next 2 lines shouldn't be changed since they are a link between main om sources and all the algorithms sources. The last line also shouldn't be changed, but it tells us that inside our default lib dir there is a subdir called openmodeller where all algorithms are in (/usr/local/lib/openmodeller, for example). So before learning how to create or install a new algorithm, we learnt how to delete one (just remove the files that have the mnemonic of the algorithm you want to remove).
75 40 Next lines are specific for each algorithm. To add a new one all we need is to forget everything that is written there and add the following lines at the end of the file (XXX is any mnemonic you want to put in your algorithm, with any size): SUBDIRS += <sources subdir> <sources subdir>... plugin_ltlibraries += libomxxx.la libomxxx_la_sources = <source file> <source file>... libomxxx_la_ldflags = noundefined libomxxx_la_libadd = $(OMLIB) libomxxx_la_cppflags = I$(OMSRCDIR) If you see the ignored lines, you will see that they are just the same thing you see here, but not with blocks fully individualized to one algorithm. The first line (SUBDIRS) is only needed when you have subdirs to make separately (with += we broke its definition to more than one line). The second one tells the lib file that your algorithm will be. The third one tells which are the source files of your algorithm (discussed ahead), including the headers. For simple codes, you probably won't need to change last lines. They are: LDFLAGS line, that have flags to the linker; LIBADD one, that have the libs it need; and CPPFLAGS, with flags to the C++ compiler. Now we know that there are only one file we have to change to add an algorithm: the Makefile.am. The other files now are algorithmspecific so we'll have to create them. Let's make an example: first of all we'll edit the discussed file and add the following lines: plugin_ltlibraries += libomdummy.la libomdummy_la_sources = dummy.cpp dummy.h libomdummy_la_ldflags = noundefined libomdummy_la_libadd = $(OMLIB) libomdummy_la_cppflags = I$(OMSRCDIR) First algorithm files Let's create our dummy.cpp and it's header dummy.h. In this moment, it's better to use the ones below even we don't know what they do. This is the first file, dummy.h: // // Dummy algorithm // // Description: An algorithm made to teach how an algorithm is made. // // Author: Danilo J. S. Bellini <danilo.estagio@gmail.com> // Copyright: See COPYING file that comes with this distribution // Date: // #ifndef _DUMMYH_ #define _DUMMYH_ #include <openmodeller/om.hh>
76 41 class DummyAlgorithm : public AlgorithmImpl{ public: DummyAlgorithm(); int initialize(); Scalar getvalue(const Sample& x) const; }; #endif This is the smallest code you can make to an clean algorithm header source file. Now the dummy.cpp file: // // Dummy algorithm // // Description: An algorithm made to teach how an algorithm is made. // // Author: Danilo J. S. Bellini <danilo.estagio@gmail.com> // Copyright: See COPYING file that comes with this distribution // Date: // #include "dummy.h" // // METADATA // #define NUM_PARAM 1 #define TESTPAR "TestParameter" #define TPARMIN 0.0 #define TPARMAX 5.0 static AlgParamMetadata parameters[num_param] = { // Parameters { // First parameter TESTPAR, // Id "Dummy", // Name "Real", // Type "XXX", // Overview "YYY", // Description 1, // Not zero if the parameter has lower limit TPARMIN, // Parameter's lower limit 1, // Not zero if the parameter has upper limit TPARMAX, // Parameter's upper limit "0.5" // Parameter's typical (default) value }, }; static AlgMetadata metadata = { // General metadata "DummyAlgorithm", // Id "Dummy Algorithm", // Name "1", // Version "Dummy.", // Overview "Algorithm made to teach how an algorithm is made.", // Description "Danilo J. S. Bellini", // Algorithm author "None", // Bibliography "Danilo J. S. Bellini", // Code author "danilo.estagio@gmail.com", // Code author's contact 0, // Does not accept categorical data 0, // Does not need (pseudo)absence points
77 42 NUM_PARAM, parameters }; // Algorithm's parameters // // LINK TO OM // // Needed code to link this algorithm to om OM_ALG_DLL_EXPORT AlgorithmImpl *algorithmfactory(){ return new DummyAlgorithm(); // Create an instance of your algorithm's class } OM_ALG_DLL_EXPORT AlgMetadata const *algorithmmetadata(){ return &metadata; } // // ALGORITHM CONSTRUCTOR/DESTRUCTOR // // Constructor for the algorithm class DummyAlgorithm::DummyAlgorithm() : AlgorithmImpl(&metadata){ } // // ALGORITHM NEEDED METHODS // // Initialize the model int DummyAlgorithm::initialize(){ return 0; } // Returns the occurrence probability at the environment conditions x Scalar DummyAlgorithm::getValue(const Sample& x) const{ return 1.0; } This second file isn't the smallest.cpp file we can create, but it's near to. Compiling To test it, we'll have to write these 2 files inside om algorithm directory and compile them, so go to om root directory (in my case ~/dev/cpp/om/) and type something like:./autogen.sh enable-python enable-soap--prefix="/usr/local/" make sudo make install The first line is needed, but it's only needed in first time when you compile om with anything modified in a Makefile.am. This call update the makefiles in all directories, because we modified the Makefile.am in the algorithms directory, but the parameters to autogen.sh may be different to you. The second line
78 43 compile om (and our new algorithm). The last line installs om (and our algorithm). Testing Now you can test it with om (we'll use om_console for now...you can use any other interface if you want). Actually, the algorithm doesn't do anything (so dummy is a good name for it), but at least we can see it in om and call: danilo@hdlaptop:~/dev/cpp/om/examples$ om_console request.txt openmodeller version 0.4 Choose an algorithm between: [0] Bioclim [1] Bioclim distance [2] Climate Space Model [3] Climate Space Model KaiserGutman [4] GARP with best subsets DesktopGARP implementation [5] Distance to average [6] Dummy Algorithm [7] Minimum distance [8] GARP DesktopGARP implementation [9] Quit Option: 6 > Algorithm used: Dummy Algorithm Algorithm made to teach how an algorithm is made. * Parameter: Dummy XXX: Dummy >= Dummy <= Enter with value [0.5]: Creating the model Exception occurred Message is Algorithm could not be initialized. As you can see, our algorithm didn't do anything, because it can't be initialized (we'll see that below), but the first step is done: we added the algorithm there! Algorithm link with om Metadata Now, let's understand what we made. An algorithm receive parameters from om (inputs, besides the environmental layers), such as the size of something
79 or how many times something have to be done. They must be explained in a static/global vector of AlgParamMetadata and it's called parameters (see dummy.cpp), but you can rename it (I don't suggest you to do that, even for the other names we'll see). NUM_PARAM was defined with the amount of parameters we have and TESTPAR is the name I had chosen to the parameter's identification for om (This one should be changed in your code, because your parameter probably won't have a mnemonic test ). As these values are used more than one time in the program, it's better to keep them defined that way. All parameters are specified that way, and the comments are helpful because they say which are the metadata we need to put in each position. Remember: DON'T remove any of these, even the value is somehow null, because the order and amount of them are importants. Each parameter is separed by commas from the others, so the block called First parameter could be copied below itself to create the second, third, etc. ones. If you want an algorithm without parameters, you should do this (but don't forget to define NUM_PARAM as 0): static AlgParamMetadata *parameters = 0; After that, we specified the unuseful details of our algorithm, things such as its name and author: this is put in a static/global AlgMetadata data type, called metadata. The rules here are almost the same of the rules for each parameter. Don't change last line inside metadata's block and things you don't know what they are. Dynamic link Next 8 lines are needed to make the connection between this algorithm and om dynamicly. The only thing you can change in there is the name DummyAlgorithm that is the name of the algorithm class as we'll see. Smallest header explanation Now let's see dummy.h (never forget to include algorithm's header in the.cpp file). It's really small, with only 10 lines containing code. A real algorithm must have a bigger header file, this one only have needed data to compile. All its code are inside an #ifndef C++ directive, that avoid including this file more than once. For your algorithm you will need to change the name _DUMMYH_ to a name you want (in #ifdef and #define lines), but I suggest to use the real file name uppercase without the dot and between underscore simbols. Your algorithm header file must include om.hh to work. Also, your algorithm class, for now called DummyAlgorithm, must be inherited from the class AlgorithmImpl (included with om.hh). The constructor must be created explicitly and the methods initialize and getvalue are needed to compilation. 44
80 45 Basic algorithm initialization Now you know how to insert an algorithm in om and how to specify it's parameters metadata, so the next step is to make this dummy algorithm work (remember it can't be initialized?) Why it can't be initialized? That happens because our initialize method returns 0 (false) always, let's change some things there, for example let's make a new initilize method in dummy.cpp, that can return 1 (true). To add some code there, let's get the parameter from the user (om do that for us, just use the method getparameter from the class we inherited) and test if it was set properly (for example, 1.3 isn't an integer value, so an integer parameter can't have this value): int DummyAlgorithm::initialize(){ if(!getparameter(testpar,&testpar)){ g_log.error(1, "Parameter '" TESTPAR "' not set properly.\n"); return 0; } return 1; } To be fully convinced that everything is right, you should add some code to verify if your parameter obeys the limit values (maximum and minimum); for example you can use the limit value instead of the wrong value. Our parameter TESTPAR will be written in testpar variable, that you should declare in the DummyAlgorithm class, better as private, so add these lines just before the }; line in dummy.h: private: Scalar testpar; Scalar datatype Why data type is Scalar? Scalar is the defined somewhere in om as double, and it's the distance unit to om, so that's why our Real type will be written in a Scalar data type. Don't redefine it, this can be found somewhere in code (if you want to see, try to type in om main source files directory, for example ~/dev/cpp/om/src/openmodeller/, this: cat * grep Scalar ): typedef double Scalar; Testing the first working algorithm Now we don't need to worry about parameters and metadata, they all are finished, and our black empty box algorithm get the parameters as inputs (don'y worry, we'll talk about the maps later), some constant outputs (metadata) and the link with om is done. Let's test our modified dummy
81 46 algorithm, so go to the om algorithms source directory to recompile and reinstall it: make sudo make install Well, we don't need to call autogen.sh because we didn't modify anything that needs that, so everything is done, all we need is to recompile because we modified our algorithm. Also, we don't need to recompile and reinstall everything, only what we changed (that's why we came to the algorithms directory, and make only compile what was changed). Let's see what happens now: Enter with value [0.5]: Creating the model Model creation: % Finished Creating Model Map creation: % Model statistics Accuracy: % Omission error: 0.00% Percentage of cells predicted present: % Total number of cells: That's all om needs to run your algorithm, so let's study what it says: see our getvalue method, it always return 1.0, that means that it ignore the maps and always says 100% of chance to have a specie here, that's why our result map is fully white. We'll talk about getvalue's parameter after we'll see what is the Sample class. A more sophisticated dummy algorithm New header Let's modify our dummy.h to have this class: class DummyAlgorithm : public AlgorithmImpl{ public: // All methods here are inherited from AlgorithmImpl DummyAlgorithm(); // Constructor, don't have init algorithm routines ~DummyAlgorithm(); // Destructor int initialize(); // Called by om to initialize the algorithm int done() const { return _done; } // Tell om when the algorithm finished its work int neednormalization(scalar *min, Scalar *max) const; // Normalize all data to [min,max]
82 47 Scalar getvalue(const Sample& x) const; // Returns the occurence probability private: // Commonuse attributes bool _initialized; // Flag to indicate that the algorithm was initialized. bool _done; // Flag to indicate when the work is finished; int _layercount; // Amount of layers used (dimension of environmental space) int _presencecount; // Amount of presence points int _absencecount; // Amount of absence points std::vector<sample> _presencepoints_env; std::vector<coord> _presencepoints_x, _presencepoints_y; // Parameters Scalar testpar; }; What's new here? The done method always returns the attribute done, for an iterative algorithm it's really useful since the iterative algorithm can say when its work has finished, that's when om finishes the algorithm iteration. As we don't have an iterative algorithm, _done will be assigned to true in the initialize method (it doesn't have to be assigned to false in the constructor, but must be assigned to false in the initialize method of an iterative algorithm). The neednormalization method isn't needed. Each layer (input) gives a value to each point of the map, this value can be normalized to be in [min,max] using this method. By default, it must return 1 (or it doen't exist, because you don't want to normalize the data). We'll talk more about it after you get knowledge about what the value of the map means. Next lines shows some common attributes we have. _initialized and _done should exist in all algorithms, since they are useful flags for the destructor and for the done method. The _initialized is set to true only at the end of the initialize method, and set to false in constructor. The attribute _layercount will have the amount of environmental layers the algorithm receive, _presencecount will have the amount of presence points and _absencecount will have the amount of absence points. The 3 vectors after these attributes will have some data from the presence points. The other new lines will be discussed later.
83 48 New dummy.cpp For example, put this in dummy.cpp, changing everything after the link with om section: // // ALGORITHM CONSTRUCTOR/DESTRUCTOR // // Constructor for the algorithm class DummyAlgorithm::DummyAlgorithm() : AlgorithmImpl(&metadata){ _initialized = false; } // Destructor for the algorithm class DummyAlgorithm::~DummyAlgorithm() { if(_initialized){ /****************************************/ /* Call all needed destructors here */ /****************************************/ } } // // ALGORITHM GENERIC METHODS (virtual AlgorithmImpl methods) // // Initialize the algorithm int DummyAlgorithm::initialize(){ // Test the parameters' data types if(!getparameter(testpar,&testpar)){ g_log.error(1, "Parameter '" TESTPAR "' wasn't set properly.\n"); return 0; } // Impose limits to the parameters, if somehow the user don't obey if (testpar>tparmax) testpar = TPARMAX; else if(testpar<tparmin) testpar = TPARMIN; // Initialize some commonuse attributes _layercount = _samp-> numindependent(); _presencecount = _samp-> numpresence(); _absencecount = _samp-> numabsence(); // Load all environmental data of presence points and put into // _presencepoints_env, and the same for X and Y coordinates if(_presencecount == 0){ g_log.error(1, "There is no presence point.\n"); return 0; } OccurrencesPtr presences = _samp->getpresences(); for (int i = 0 ; i < _presencecount ; i++){ _presencepoints_env.push_back((*presences)[i]->environment()); _presencepoints_x.push_back ((*presences)[i]->x()); _presencepoints_y.push_back ((*presences)[i]->y()); }
84 49 /****************************************************************************/ /* Call needed constructors and other initialization operations here */ /****************************************************************************/ _done = true; // Needed for notiterative algorithms //_done = false; // Needed for iterative algorithms _initialized = true; } return 1; // There was no problem in initialization // Normalize all data to [min,max] int DummyAlgorithm::needNormalization(Scalar *min, Scalar *max) const{ *min = TPARMIN; *max = TPARMAX; return 1; } // Returns the occurrence probability Scalar DummyAlgorithm::getValue(const Sample& x) const{ return 1.0; } New initialization ritual The constructor have only what was said, and the destructor tests this value because somehow the algorithm can be destroyed before it calls the initialize method, so we can't destroy notcreated objects (the reason for the existance of this attribute). All methods above are inherit from AlgorithmImpl. Our initialize method now imposes limits to testpar, so we can use it even if the om user interface allows bad inputs. The 3 attributes _layercount, _presencecount and _absencecount are the result of 3 methods from a sampler object called _samp, that we can use here. I suggest you to do everything you want with this object in this method (initialize) and forget that it exists after that (of course, for a better code, you should create private methods to get the data from _samp if you see that the code using it will be huge, and call them in this initialization method). What's _samp object? What's _samp object? Better, what's the SamplerPtr / SamplerImpl class? What do we need to know about them? Sample class We can't know what they are without the data structures, so I'll tell you about the Sample data, that is basic for environmental data. A Sample is a customized version of a std::vector<scalar>. For one point (with coordinates X and Y) we'll have a Scalar value for each layer, so, for each point, we can
85 have a Sample with all the data from the layers. Example in a 3x3 map with 2 layers: 50 The samples can be assigned to other as Sample newsample = x; if your algorithm need a backup. To acess randomly any data from a sample you can use the [] simbols, that they'll return a Scalar. There are some pointwise operations allowed ( +=, =, *=, /=, &= and = ): a pointwise operation is an operation that is done for each pair of data, that means that a += will sum the 2 vectors as we see in maths, but something strange happens with multiplication and division. &= returns the minimum value between the 2 vectors and = returns the maximum value between the 2 vectors, for example: Vector1:=( 1 ; 15 ; 14 ; 17 ) Vector2:=(18 ; 14 ; 12 ; 20 ) After Vector1 &= Vector2: Vector1:=( 1 ; 14 ; 12 ; 17 ) After Vector1 = Vector2 (The 2 first Vectors of the example!): Vector1:=(18 ; 15 ; 14 ; 20 ) The operators +=, =, *= and /= are also defined to have a Scalar argument as it were a Sample with the same value in all the vector. There
86 51 are some methods you can use from the Sample class (iterator is a Scalar* typedef internal to this class, and const_iterator too, but as a constant): Resize the vector to the new size passed as the parameter void resize(std::size_t size); Returns the current size of the vector std::size_t size() const; Iterative form of using the vector // Example (implementation of sqr method, explained below): // // for(iterator it = begin(); it!= end() ; it++) // *it = (*it) * (*it); // iterator begin(); iterator end(); const_iterator begin() const; const_iterator end() const; Compare 2 Sample instances: this and the constant parameter. Return true only if they have the same size and the same values in the same order. bool equals(const Sample&) const; Calling sqr(x); have the same effect of X *= X ; Sample& sqr(); Calcs the square root for each value in the vector and write it in itself, then return Sample& sqrt(); Return the norm of the vector this. By maths, the norm is the square root of the dot product of a vector by itself Scalar norm() const; Calcs the dot product of this with rhs, that means the sum of the values of a pointwise multiplication between this and rhs Scalar dotproduct(const Sample& rhs) const; A Sample is an point in a multidimensional world (one dimension for each layer). For the example given above, we have a bidimensional world (2 layers). For one dimension we have 1 layer (e.g. Layer 0), so imagine it as our axis, in that example we have points from 4 to 56 in this axis. Adding another dimension (e.g. Layer 1), we'll have a new axis, creating an angle of 90 degrees with all the other ones we've seen before. This time it's a 2D plan, where the points are given by environmental data and not spacial relative distances. Algorithms for om can't use X and Y coordinates, the reason will be explained later (in the Environmental classes section).
87 52 Sampler classes Think that the data from om inputs arrive to the algorithms as a wizard summons a magical being: we don't need to worry about what is done with original data before we get them, all we have to know is how to get them. The _samp, as any sampler object, have 3 kinds of data: environmental data (all layers), presence points (all) and absence points. As _samp is a SamplerPtr instance and not a SamplerImpl one, we'll use > instead of. to call the methods (that's not hard to understand, and happens to all XXXPtr classes that are pointers to XXXImpl classes), and the SamplerImpl methods we can use are: To get all data of one of the 3 parts of an Sampler class. Explanation about data types is done below EnvironmentPtr getenvironment(); ConstEnvironmentPtr getenvironment() const; OccurrencesPtr getpresences(); ConstOccurrencesPtr getpresences() const; OccurrencesPtr getabsences(); Small info this class can give Amount of independent variables, easier, amount of layers used dimension of environmental space) int numindependent() const; Amount of dependent variables int numdependent() const; Amount of presence points / occurrence points int numpresence() const; Amount of absence points / localities with no occurrence int numabsence() const; Returns a random occurrence, in the first case that's an absence or a presence point (probability = 0.5) and if there's any real absence point then it doen't return an pseudoabsence point (a point that that isn't a presence point). The other ones are easier. ConstOccurrencePtr getonesample( ) const; ConstOccurrencePtr getpresence() const; ConstOccurrencePtr getabsence() const; ConstOccurrencePtr getpseudoabsence() const; It's a test for categorial layers. If the layer i is categorical it returns notzero. Don't worry with categorical layers for now. int iscategorical( int i );
88 53 Occurrence and Occurrences classes Probably you can't understand the Sampler classes without understanding what is an OccurrencePtr ( pointer class to OccurrenceImpl class), because the presences and absences are OccurrencePtr instances. Warning: OccurrencesImpl and OccurrenceImpl are different things! OccurrencesImpl is about the same of Sample: it's an OccurrencePtr vector (not a Scalar one). OccurrenceImpl doesn't have many methods, and all we need to know is that an occurrence have 2 coordinates (x and y) and the environmental Sample for this point. The other data it have is the uncertanty of this point and attributes. You can access the locality information with the methods: Coord x() const; // Probably you won't need these ones Coord y() const; Scalar error() const; Scalar abundance() const; Sample const & attributes() const; Sample const & environment() const; // This one you certainly will use The coordinate unit Coord is defined as double somewhere in code (do the same you did with Scalar to find it). These are only get methods for X and Y coordinates, for the uncertanty (error method), the attribute abundance, others attributes you want and the environment Sample. There's only one more method you might want to use is the bool hasenvironment() const;, that verify if the environment Sample exist (probably you won't need this too). The other 3 methods it have are used to manually normalize that Sample, what we really doesn't need to know. For your algorithm probably all you want to know is the environment method, since it gives the Sample of the occurrence. An example of an algorithm that uses coordinates is one that receives the coordinetes of some points as parameters to give different weights to them, manually. Now, for the customized std::vector<occurrenceptr> called OccurrencesImpl, we have some more info: the occurrences' name (commonly the species name) and the coordinate system found in the OccurrenceImpl points. It also have the random access by [] and the iterative access by begin and end methods, but this time the iterator is a std::vector<occurrenceptr>, and we also can use const_iterator. This class have the methods: Returns a copy of a OccurrencesImpl OccurrencesImpl* clone() const; Calls std::vector<>::reserve() void reserve(int estimate); Gets the name and coordinate system strings (almost unuseful for us) char const * name() const; char const * coordsystem() const;
89 54 Returns true if there are environmental data bool hasenvironment() const; Returns the amount of environmental layers int dimension() const; Add a new occurrence (useful for iterative algorithms that supposes new occurrences where have high probability of occurrence). The first one is deprecated. void createoccurrence(coord longitude, Coord latitude, Scalar error, Scalar abundance, int num_attributes = 0, Scalar *attributes = 0, int num_env = 0, Scalar *env = 0); void createoccurrence(coord longitude, Coord latitude, Scalar error, Scalar abundance, std::vector<double> attributes, std::vector<double> env); void insert(const OccurrencePtr&); Erase the occurrence chosen by the iterator iterator erase(const iterator& it); Return the amount of occurrences exist in this object (size of the vector) int numoccurrences() const; Return a OccurrenceImpl chosen at random ConstOccurrencePtr getrandom() const; Calls std::vector<>::empty() bool isempty() const; Push back the entire source vector (calls the std::vector<>::pushback method) void appendfrom(const OccurrencesPtr& source); Print verbosely all contents of this. void print(char *msg="") const; Environment classes Commonly you won't need to use the info directly from EnvironmentImpl, the most important text here is this paragraph, ignore the methods, unless you have a really strange algorithm that needs to call them. Here lies the maps, so maximum and minimum values of the coordinates X and Y are here, information about a mask is here too, and other useful information. When the OpenModeller object calls the AlgorithmImpl::getValue, it sends the return of the EnvironmentImpl::get(x,y) method, so that's why we don't have the X and Y coordinates of the point that called OpenModeller::getValue(x,y). Information about normalization is also here, but for normalization of environmental data you only have to use the lgorithmimpl::neednormalization method, don't forget, because you don't know if there are several places that have to be normalized. The methods of the EnvironmentImpl class are:
90 int numlayers() const; int iscategorical(int i); Sample get(coord x, Coord y) const; Sample getrandom( Coord *x = 0, Coord *y = 0 ) const; int check(coord x, Coord y) const; int getregion(coord *xmin, Coord *ymin, Coord *xmax, Coord *ymax) const; int getextremes(sample* min, Sample* max) const; This class have several methods we don't have to know, these ones are enough. The first one is obvious, the second was discussed before but we're not concerned about categorical data for now, the third is the get method seen in last paragraph. The method getrandom is the same of the get one, but the values x and y are get randomly inside the mask. The method check returns false (zero) when the point given isn't inside the mask. The method getregion tells all limits of the coordinates as a rectangle (remember the mask don't need to be a rectangle). The method getextremes gives us 2 Samples with the minimum and maximum value of each layer. It can be used by algorithms that don't normalize data, for example. Sophisticated dummy algorithm explanation At this time you are able to understood by yourself what the dummy algorithm does, but it's hard to understand without examples, so let's understood what it says int _layercount; // Amount of layers used (dimension of environmental space) int _presencecount; // Amount of presence points int _absencecount; // Amount of absence points std::vector<sample> _presencepoints_env; std::vector<coord> _presencepoints_x, _presencepoints_y; The amount values are got from _sampl object: // Initialize some common-use attributes _layercount = _samp->numindependent(); _presencecount = _samp->numpresence(); _absencecount = _samp->numabsence(); The vectors of _presencepoints can be get using the OccurrencesPtr object from _samp->getpresences(): // Load all environmental data of presence points and put into // _presencepoints_env, and the same for X and Y coordinates if(_presencecount == 0){ g_log.error(1, "There is no presence point.\n"); return 0; 55
91 56 } OccurrencesPtr presences = _samp->getpresences(); for(int i = 0 ; i < _presencecount ; i++){ _presencepoints_env.push_back((*presences)[i]->environment()); _presencepoints_x.push_back ((*presences)[i]->x()); _presencepoints_y.push_back ((*presences)[i]->y()); } The X and Y values are almost unuseful, so you can ignore them and create only one vector with all environmental data from presence points, called _presencepoints (without the _env). When you see (*presences)[i]> environment());, doesn't get mad, the 2 contents done is because we have a pointer of pointer (remember that the operator [] to be applied in OccurrencesPtr need to have the *, since it's a pointer). The ith element of the OccurrencesImpl (*presences) is an OccurrencePtr, so we'll use the > operator to call its methods. The methods used get the environment Sample and the coordinates and push into the _presencepoint as a stack. See that now we can use_presencepoints anywhere in the algorithm, which is easier do understand (it's a vector). To access the ith Sample you can use _presencepoints[i] and the jth Scalar of this Sample, you can use _presencepoints[i][j], as used in common C matrix implementation. The same can be done with absence points. The neednormalization can be easily understood now: // Normalize all data to [min,max] int DummyAlgorithm::needNormalization(Scalar *min, Scalar *max) const{ *min = TPARMIN; *max = TPARMAX; return 1; } The values in the layers will now be limited to a minimum of TPARMIN and a maximum of TPARMAX. The offsets and scales to do that are done automaticly by om after you return 1. AlgorithmImpl, daddy of my algorithm All we need to know about AlgorithmImpl is what we can inherit (no consideration with its daddy...what a bad algorithm!). From now we know the methods: int initialize(); int done() const; int neednormalization(scalar *min, Scalar *max) const; Scalar getvalue(const Sample& x) const;
92 57 But for a iterative algorithm, we'll need more methods. Here's all other methods you can inherit from this class: int supportsmodelprojection() const int iterate(); int finalize(); int getconvergence(scalar const *val) const; float getprogress() const; Model getmodel() const; void _getconfiguration(configurationptr&) const; void _setconfiguration(const ConstConfigurationPtr&); To create an iterative algorithm, the first thing you should do is to inherit the iterate method and change the _done attribute to false in the initialize method. The iterate method should return 1, and it considers that you are training stepbystep until _done goes to true or when the iterate method returns 0 (telling that something wrong happened). After that the finalize method is called, so you can finish the training phase in other place to avoid things like a if(done()) inside the iterate method; this method should return 1 too and doen't need to exist, even in a iterative algorithm (to be more complete, it's executed even without the iterate method, after it sees that _done is true). The method getprogress is useful to give to the user information about how much is done. By default, it returns 0 while _done is false and 1 when _done becomes true. All you have to do is create an attribute (why not float _progress;?), initialize it and increment in your iterate method (that can be complicated for some algorithms), and add this method inline, returning the new attribute. Other method is getconvergence that returns the convergence value at the moment. By default it always return zero, but if you have this information in your algorithm you can put there. The other 3 methods...

93 Annex 06 1
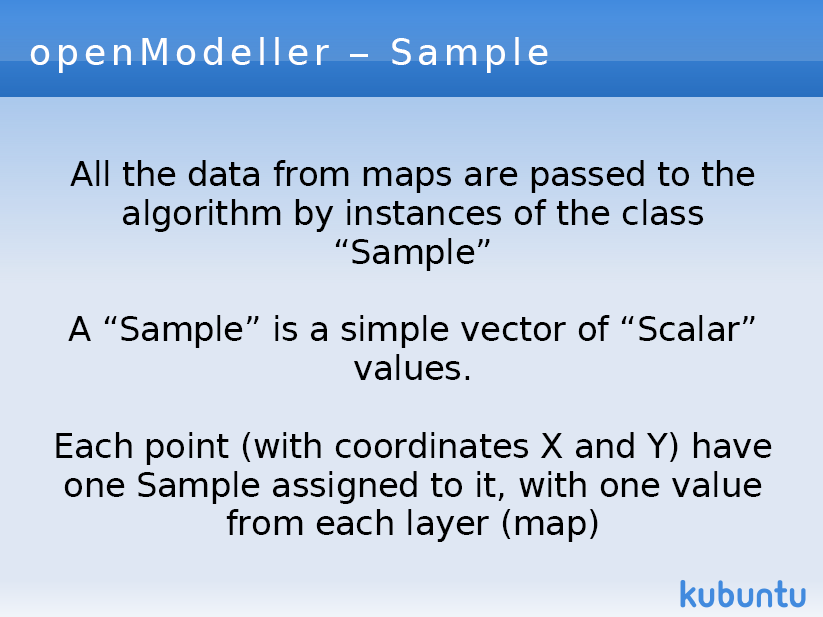
94 2
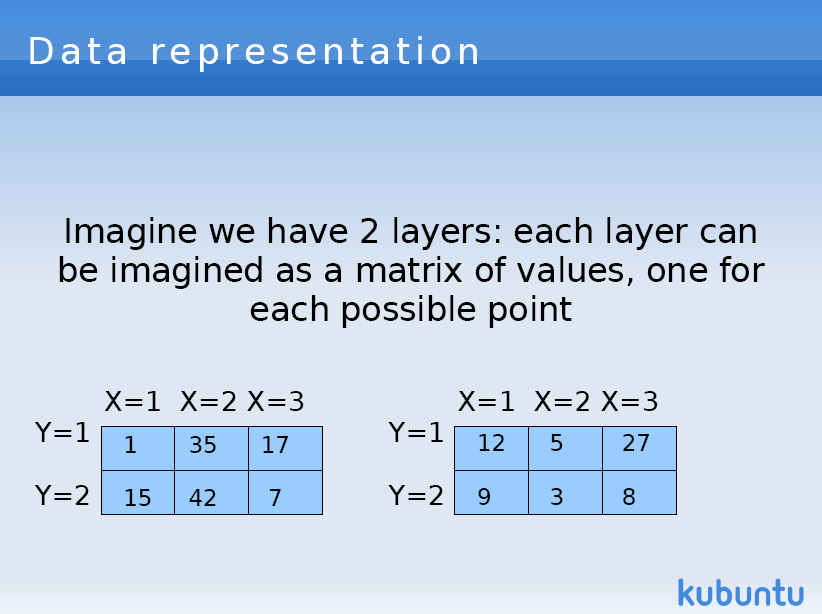
95 3
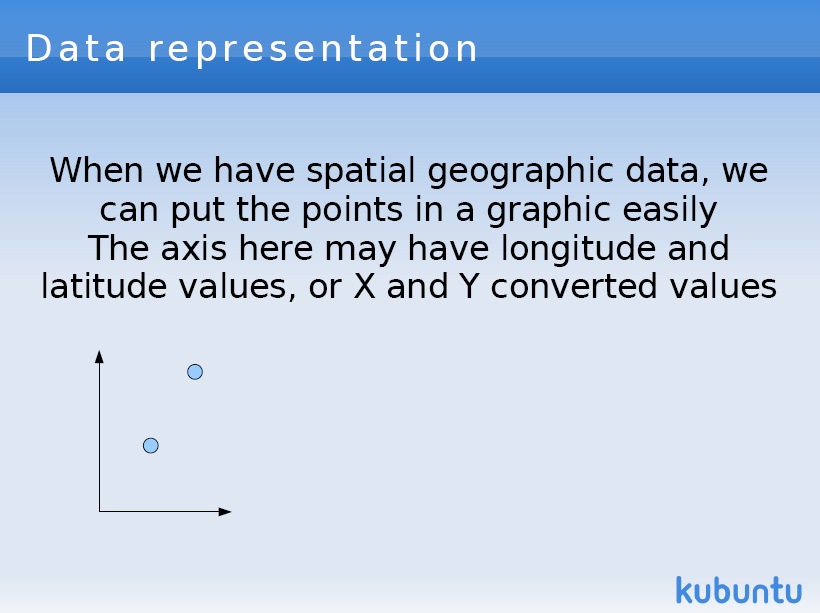
96 4

97 5
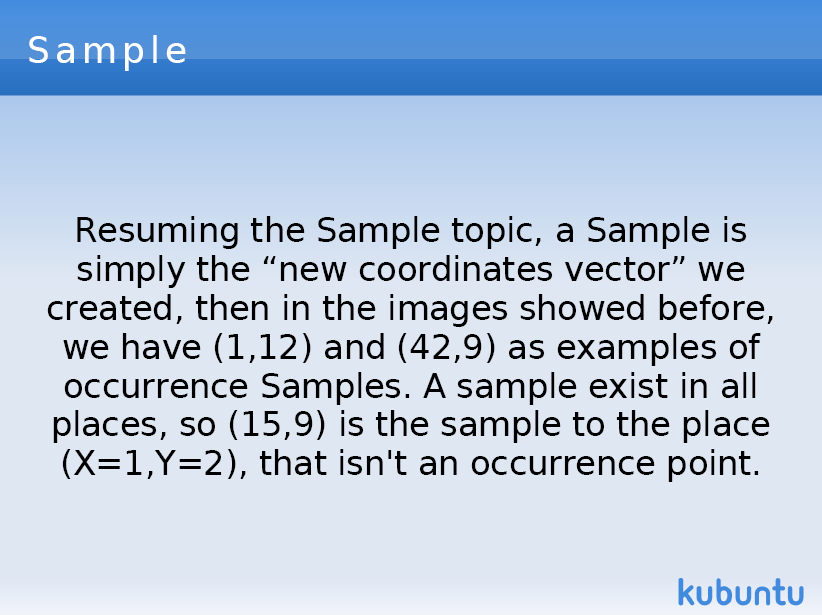
98 6
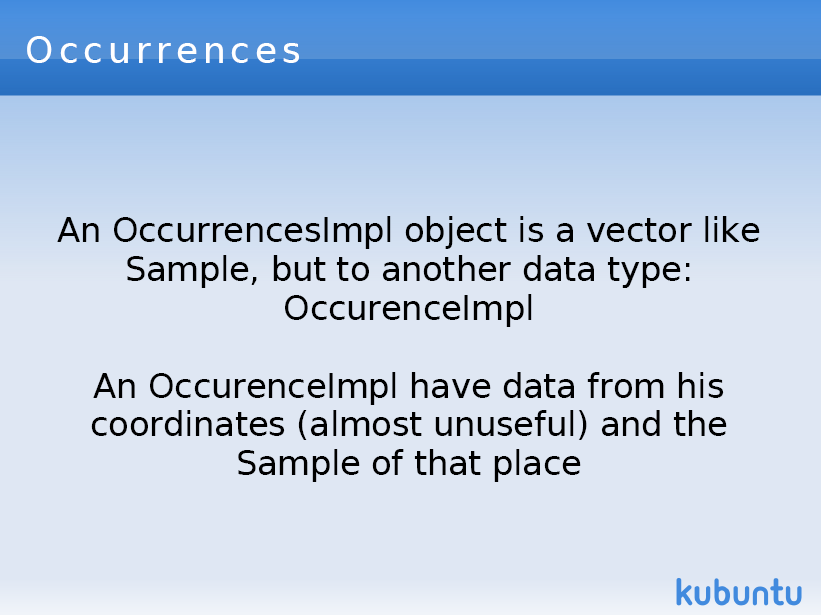
99 7
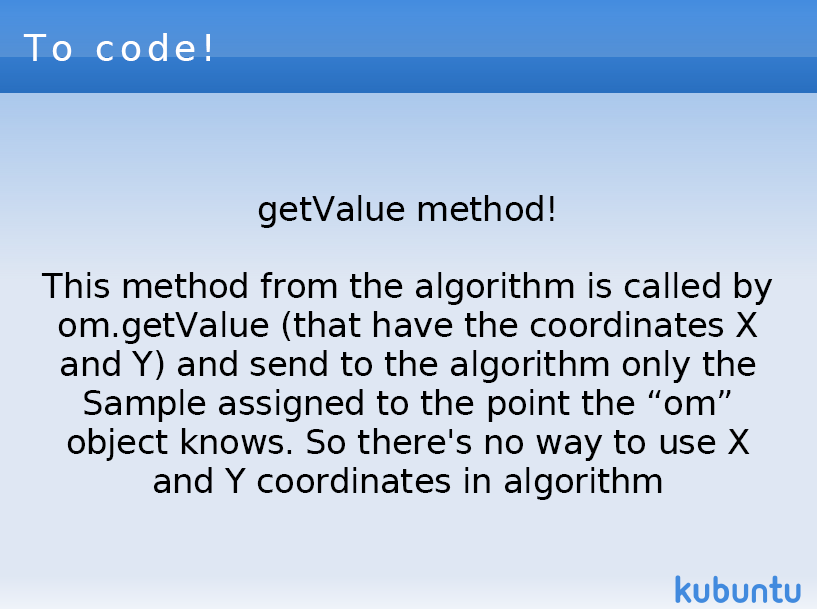
100 8
101 9
102 1 Annex 07 openmodeller Class Documentation SamplerImpl Class Reference #include <Sampler.hh> Detailed Description Base class to create samplers of environmental variables and occurrence data. Each derived class can implement different behaviors, such as proportional sampling according to the distribution of occurrence data, disproportional sampling regarding presence and absence data, etc. Public Member Functions SamplerImpl () SamplerImpl (const EnvironmentPtr &env, const OccurrencesPtr &presences, const OccurrencesPtr &absence) ~SamplerImpl () EnvironmentPtr getenvironment () ConstEnvironmentPtr getenvironment () const OccurrencesPtr getpresences () ConstOccurrencesPtr getpresences () const OccurrencesPtr getabsences () ConstOccurrencesPtr getabsences () const void getminmax (Sample *min, Sample *max) const void normalize (bool use_norm, const Sample &offsets, const Sample &scales) int numindependent () const int numdependent () const int numpresence () const int numabsence () const ConstOccurrencePtr getonesample () const ConstOccurrencePtr getpresence () const ConstOccurrencePtr getabsence () const ConstOccurrencePtr getpseudoabsence () const int iscategorical (int i) void environmentallyunique () void spatiallyunique () ConfigurationPtr getconfiguration () const void setconfiguration (const ConstConfigurationPtr &) Private Member Functions ConstOccurrencePtr getrandomoccurrence (const OccurrencesPtr &occur) const void setenvironmentinoccurrences () void environmentallyunique (OccurrencesPtr &occurrencesptr, const char *type) void spatiallyunique (OccurrencesPtr &occurrencesptr, const char *type) 1
103 2 Private Attributes OccurrencesPtr _presence OccurrencesPtr _absence EnvironmentPtr _env Friends class ReferenceCountedPointer<SamplerImpl> class ReferenceCountedPointer<const SamplerImpl> SamplerPtr createsampler (const ConstConfigurationPtr &) Constructor & Destructor Documentation SamplerImpl::SamplerImpl () SamplerImpl::SamplerImpl (const EnvironmentPtr & env, const OccurrencesPtr & presences, const OccurrencesPtr & absence) SamplerImpl::~SamplerImpl () Definition at line 99 of file Sampler.cpp. Member Function Documentation void SamplerImpl::environmentallyUnique (OccurrencesPtr & occurrencesptr, const char * type) [private] Definition at line 385 of file Sampler.cpp. References _env.void SamplerImpl::environmentallyUnique () Remove sample duplicates accross the environment (presences and absences are treated separately). After erasing a point, the remaining one increases the abundance by one. Definition at line 372 of file Sampler.cpp. References _absence, and _presence.constoccurrenceptr SamplerImpl::getAbsence () const [inline] Get one Absence point Definition at line 146 of file Sampler.hh. Referenced by getonesample().constoccurrencesptr SamplerImpl::getAbsences () const [inline] 2
104 3 Definition at line 95 of file Sampler.hh.OccurrencesPtr SamplerImpl::getAbsences () [inline] Definition at line 94 of file Sampler.hh.ConfigurationPtr SamplerImpl::getConfiguration () const Definition at line 127 of file Sampler.cpp. References _absence, _env, and _presence.constenvironmentptr SamplerImpl::getEnvironment () const [inline] Definition at line 89 of file Sampler.hh.EnvironmentPtr SamplerImpl::getEnvironment () [inline] Definition at line 88 of file Sampler.hh.void SamplerImpl::getMinMax (Sample * min, Sample * max) const Indicate that all non categorical variable layers must be normalized according to the interval [min, max]. Returns through offsets, scales the normalization parameters. Definition at line 212 of file Sampler.cpp. References _absence, _env, and _presence.constoccurrenceptr SamplerImpl::getOneSample () const Samples one presence, absence or pseudo-absence point in a uniform way. There is 50% of chance to get a presence point and 50% of get an absence or pseudo-absence point. If there are real absence points (user input) then only absence are sampled. If there are not real absence, samples pseudo-absence points. Parameters: independent Filled in with values of the independent variables of the sample. Returns: Zero if got an absence or pseudo-absence point and not zero if got a presence point. Definition at line 304 of file Sampler.cpp. References _absence, _presence, getabsence(), getpresence(), and getpseudoabsence(). ConstOccurrencePtr SamplerImpl::getPresence () const [inline] Get one Presence point Definition at line 140 of file Sampler.hh. 3
105 Referenced by getonesample().constoccurrencesptr SamplerImpl::getPresences () const [inline] 4 Definition at line 92 of file Sampler.hh.OccurrencesPtr SamplerImpl::getPresences () [inline] Definition at line 91 of file Sampler.hh.ConstOccurrencePtr SamplerImpl::getPseudoAbsence () const Get one pseudoabsence point Definition at line 330 of file Sampler.cpp. References _env, and numdependent(). Referenced by getonesample(). ConstOccurrencePtr SamplerImpl::getRandomOccurrence (const OccurrencesPtr & occur) const [private] Definition at line 508 of file Sampler.cpp.int SamplerImpl::isCategorical (int i) Returns 1 if i-th variable is categorical, otherwise returns 0. Definition at line 353 of file Sampler.cpp. References _env.void SamplerImpl::normalize (bool use_norm, const Sample & offsets, const Sample & scales) Set specific normalization parameters Definition at line 236 of file Sampler.cpp. References _absence, _env, _presence, and setenvironmentinoccurrences(). int SamplerImpl::numAbsence () const Number of absences (localities with no occurrence). Definition at line 297 of file Sampler.cpp. References _absence.int SamplerImpl::numDependent () const Number of dependent variables (attributes of the occurred thing). These are the variables to be modelled. Definition at line 279 of file Sampler.cpp. References _presence. 4
106 Referenced by getpseudoabsence().int SamplerImpl::numIndependent () const Number of independent variables (environmental variables). 5 Definition at line 260 of file Sampler.cpp. References _env, and _presence.int SamplerImpl::numPresence () const Number of presences (occurrence points). Definition at line 288 of file Sampler.cpp. References _presence.void SamplerImpl::setConfiguration (const ConstConfigurationPtr &) Definition at line 155 of file Sampler.cpp. References _absence, _env, _presence, and setenvironmentinoccurrences(). void SamplerImpl::setEnvironmentInOccurrences () [private] Definition at line 107 of file Sampler.cpp. References _absence, _env, and _presence. Referenced by normalize(), SamplerImpl(), and setconfiguration().void SamplerImpl::spatiallyUnique (OccurrencesPtr & occurrencesptr, const char * type) [private] Definition at line 447 of file Sampler.cpp. References _env.void SamplerImpl::spatiallyUnique () Remove sample duplicates accross geographic space (presences and absences are treated separately). After erasing a point, the remaining one increases the abundance by one. Uniqueness is considered for row/col pairs defined in the input mask. If mask is undefined, use first layer as a mask. Definition at line 434 of file Sampler.cpp. References _absence, and _presence. Friends And Related Function Documentation SamplerPtr createsampler (const ConstConfigurationPtr &) [friend] 5
107 Definition at line 61 of file Sampler.cpp.friend class ReferenceCountedPointer<const SamplerImpl> [friend] 6 Definition at line 77 of file Sampler.hh.friend class ReferenceCountedPointer<SamplerImpl> [friend] Definition at line 76 of file Sampler.hh. Member Data Documentation OccurrencesPtr SamplerImpl::_absence [private] Definition at line 191 of file Sampler.hh. Referenced by environmentallyunique(), getconfiguration(), getminmax(), getonesample(), normalize(), numabsence(), setconfiguration(), setenvironmentinoccurrences(), and spatiallyunique().environmentptr SamplerImpl::_env [private] Definition at line 192 of file Sampler.hh. Referenced by environmentallyunique(), getconfiguration(), getminmax(), getpseudoabsence(), iscategorical(), normalize(), numindependent(), setconfiguration(), setenvironmentinoccurrences(), and spatiallyunique().occurrencesptr SamplerImpl::_presence [private] Definition at line 190 of file Sampler.hh. Referenced by environmentallyunique(), getconfiguration(), getminmax(), getonesample(), normalize(), numdependent(), numindependent(), numpresence(), setconfiguration(), setenvironmentinoccurrences(), and spatiallyunique(). Functions SamplerPtr createsampler (const EnvironmentPtr &env, const OccurrencesPtr &presence, const OccurrencesPtr &absence) SamplerPtr createsampler (const ConstConfigurationPtr &config) static void splitoccurrences (OccurrencesPtr &occurrences, OccurrencesPtr &trainoccurrences, OccurrencesPtr &testoccurrences, double proptrain) void splitsampler (const SamplerPtr &orig, SamplerPtr *train, SamplerPtr *test, double proptrain) 6
108 7 Function Documentation SamplerPtr createsampler (const ConstConfigurationPtr & config) Definition at line 61 of file Sampler.cpp. References SamplerPtr.SamplerPtr createsampler (const EnvironmentPtr & env, const OccurrencesPtr & presence, const OccurrencesPtr & absence = OccurrencesPtr()) Factory method that creates a Sampler based on Environment and Occurrences objects Definition at line 54 of file Sampler.cpp.static void splitoccurrences (OccurrencesPtr & occurrences, OccurrencesPtr & trainoccurrences, OccurrencesPtr & testoccurrences, double proptrain) [static] Definition at line 522 of file Sampler.cpp. Referenced by splitsampler().void splitsampler (const SamplerPtr & orig, SamplerPtr * train, SamplerPtr * test, double proptrain) Splits data points into to 2 new samplers Parameters: orig Original sampler to split train Pointer to train sampler to be returned test Pointer to test sampler to be returned proptrain Percentage of points to go to train sampler Definition at line 575 of file Sampler.cpp. References splitoccurrences(). Typedefs typedef ReferenceCountedPointer< const SamplerImpl > ConstSamplerPtr Functions dllexp void splitsampler (const SamplerPtr &orig, SamplerPtr *train, SamplerPtr *test, double proptrain) SamplerPtr createsampler (const EnvironmentPtr &env, const OccurrencesPtr &presence, const OccurrencesPtr &absence=occurrencesptr()) SamplerPtr createsampler (const ConstConfigurationPtr &config) Variables typedef ReferenceCountedPointer< SamplerImpl > SamplerPtr 7
109 8 Typedef Documentation typedef ReferenceCountedPointer<const SamplerImpl> ConstSamplerPtr Definition at line 47 of file Sampler.hh. Function Documentation SamplerPtr createsampler (const ConstConfigurationPtr & config) Definition at line 61 of file Sampler.cpp. References SamplerPtr.SamplerPtr createsampler (const EnvironmentPtr & env, const OccurrencesPtr & presence, const OccurrencesPtr & absence = OccurrencesPtr()) Factory method that creates a Sampler based on Environment and Occurrences objects Definition at line 54 of file Sampler.cpp. References SamplerPtr.dllexp void splitsampler (const SamplerPtr & orig, SamplerPtr * train, SamplerPtr * test, double proptrain) Splits data points into to 2 new samplers Parameters: orig Original sampler to split train Pointer to train sampler to be returned test Pointer to test sampler to be returned proptrain Percentage of points to go to train sampler Definition at line 575 of file Sampler.cpp. References splitoccurrences(). Variable Documentation class typedef ReferenceCountedPointer<SamplerImpl> SamplerPtr Definition at line 45 of file Sampler.hh. Referenced by createsampler() 8
110 9 Annex 08 openmodeller Class Documentation ConfusionMatrix Class Reference #include <ConfusionMatrix.hh> Detailed Description Class ConfusionMatrix tabulates the proportions of types of successes and errors generated by the model. The matrix is represented as following: Actual Values + Predicted Values Presence Absence Presence a b Absence c d Values a and d are correct predictions, while b and c are Type I and Type II errors. Public Member Functions ConfusionMatrix (Scalar predictionthreshold=0.5) ~ConfusionMatrix () void reset (Scalar predictionthreshold=0.5) void calculate (const EnvironmentPtr &env, const Model &model, const OccurrencesPtr &presences, const OccurrencesPtr &absences=occurrencesptr()) void calculate (const Model &model, const SamplerPtr &sampler) int getvalue (Scalar predictionvalue, Scalar actualvalue) double getaccuracy () const double getomissionerror () const double getcommissionerror () const bool ready () ConfigurationPtr getconfiguration () const Private Attributes int _confmatrix [2][2] Scalar _predictionthreshold bool _ready 9
111 10 Constructor & Destructor Documentation ConfusionMatrix::ConfusionMatrix (Scalar predictionthreshold = 0.5) Default constructor. Parameters: predictionthreshold Threshold for prediction values, above which a prediction value means a predicted presence. Definition at line 41 of file ConfusionMatrix.cpp. References reset(). ConfusionMatrix::~ConfusionMatrix () Destructor. Definition at line 47 of file ConfusionMatrix.cpp. Member Function Documentation void ConfusionMatrix::calculate (const Model & model, const SamplerPtr & sampler) Calculate confusion matrix based on an abstract Sampler object Parameters: model Model object to be evaluated Sampler Pointer to a Sampler object that will provide data for evaluation Definition at line 164 of file ConfusionMatrix.cpp. References calculate(). void ConfusionMatrix::calculate (const EnvironmentPtr & env, const Model & model, const OccurrencesPtr & presences, const OccurrencesPtr & absences = OccurrencesPtr()) Calculate confusion matrix based on model and sampled data from environment and occurrences objects. Parameters: env Pointer to Environment object containing the environmental data to be used in calculation model Model object to be evaluated presences Pointer to an Occurrences object storing the presence points being evaluated absences Pointer to an Occurrences object storing the absence points being evaluated Definition at line 67 of file ConfusionMatrix.cpp. References _confmatrix, _predictionthreshold, _ready, and reset(). 10
112 11 Referenced by calculate(). double ConfusionMatrix::getAccuracy () const Returns the accuracy of the model, which corresponds to the sum of successes (points predicted correctly) divided by all available points. I.e., accuracy = (a + d) / (a + b + c + d) Definition at line 183 of file ConfusionMatrix.cpp. References _confmatrix, and _ready. Referenced by getconfiguration().double ConfusionMatrix::getCommissionError () const Returns the commission error of the model, which corresponds to the sum of absence points predicted present divided by all available absence points. I.e., omission = b / (b + d) Definition at line 196 of file ConfusionMatrix.cpp. References _confmatrix, and _ready. Referenced by getconfiguration().configurationptr ConfusionMatrix::getConfiguration () const Serialize the confusion matrix Definition at line 216 of file ConfusionMatrix.cpp. References getaccuracy(), getcommissionerror(), and getomissionerror(). double ConfusionMatrix::getOmissionError () const Returns the omission error of the model, which corresponds to the sum of presence points predicted absent divided by all available presence points. I.e., omission = c / (a + c) Definition at line 206 of file ConfusionMatrix.cpp. References _confmatrix, and _ready. Referenced by getconfiguration().int ConfusionMatrix::getValue (Scalar predictionvalue, Scalar actualvalue) Returns a value from the confusion matrix. Parameters: predictionvalue Prediction value corresponding to the row selected in the matrix actualvalue Actual value corresponding to the column selected in the matrix Definition at line 171 of file ConfusionMatrix.cpp. References _confmatrix, and _predictionthreshold.bool ConfusionMatrix::ready () [inline] Check whether the confusion matrix has been calculated already 11
113 12 Definition at line 136 of file ConfusionMatrix.hh.void ConfusionMatrix::reset (Scalar predictionthreshold = 0.5) Resets area counters. Parameters: predictionthreshold New threshold for prediction values, above which a prediction value means a predicted presence. Definition at line 52 of file ConfusionMatrix.cpp. References _confmatrix, _predictionthreshold, and _ready. Referenced by calculate(), and ConfusionMatrix(). Member Data Documentation int ConfusionMatrix::_confMatrix[2][2] [private] Definition at line 156 of file ConfusionMatrix.hh. Referenced by calculate(), getaccuracy(), getcommissionerror(), getomissionerror(), getvalue(), and reset().scalar ConfusionMatrix::_predictionThreshold [private] Definition at line 158 of file ConfusionMatrix.hh. Referenced by calculate(), getvalue(), and reset().bool ConfusionMatrix::_ready [private] Definition at line 160 of file ConfusionMatrix.hh. Referenced by calculate(), getaccuracy(), getcommissionerror(), getomissionerror(), and reset(). 12
114 13 Annex 09 openmodeller Class Documentation AreaStats Class Reference #include <AreaStats.hh> Public Member Functions AreaStats (Scalar predictionthreshold=0.5) AreaStats (const AreaStats *areastats) ~AreaStats () void reset (Scalar predictionthreshold=0.5) void addprediction (Scalar predictionvalue) void addnonprediction () int gettotalarea () const int getareapredictedpresent () const int getareapredictedabsent () const int getareanotpredicted () const Scalar getpredictionthreshold () const ConfigurationPtr getconfiguration () const Private Attributes int _areatotal int _areapredpresent int _areapredabsent int _areanotpredicted Scalar _predictionthreshold Constructor & Destructor Documentation AreaStats::AreaStats (Scalar predictionthreshold = 0.5) Default constructor. Parameters: predictionthreshold Threshold for prediction values, above which a prediction value means a predicted presence. Definition at line 33 of file AreaStats.cpp. References reset(). AreaStats::AreaStats (const AreaStats * areastats) Copy constructor. Parameters: areastats Pointer to an AreaStats object to be copied. 13
115 14 Definition at line 38 of file AreaStats.cpp.AreaStats::~AreaStats () Destructor. Definition at line 46 of file AreaStats.cpp. Member Function Documentation void AreaStats::addNonPrediction () Count a cell where the prediction doesn't apply. Definition at line 67 of file AreaStats.cpp. References _areanotpredicted, and _areatotal.void AreaStats::addPrediction (Scalar predictionvalue) Count another cell based on its prediction value. Parameters: predictionvalue Value of the prediction in the current cell. Definition at line 57 of file AreaStats.cpp. References _areapredabsent, _areapredpresent, _areatotal, and _predictionthreshold.int AreaStats::getAreaNotPredicted () const [inline] Returns total number of cells where prediction doesn't apply. Definition at line 94 of file AreaStats.hh.int AreaStats::getAreaPredictedAbsent () const [inline] Returns total number of cell predicted absent. Definition at line 89 of file AreaStats.hh.int AreaStats::getAreaPredictedPresent () const [inline] Returns total number of cell predicted present. Definition at line 84 of file AreaStats.hh.ConfigurationPtr AreaStats::getConfiguration () const Serialize the area stats Definition at line 75 of file AreaStats.cpp. 14
116 15 References _areapredpresent, _areatotal, and _predictionthreshold.scalar AreaStats::getPredictionThreshold () const [inline] Returns the prediction threshold. Definition at line 99 of file AreaStats.hh.int AreaStats::getTotalArea () const [inline] Returns total number of cells counted. Definition at line 79 of file AreaStats.hh.void AreaStats::reset (Scalar predictionthreshold = 0.5) Resets area counters. Parameters: predictionthreshold New threshold for prediction values, above which a prediction value means a predicted presence. Definition at line 50 of file AreaStats.cpp. References _areanotpredicted, _areapredabsent, _areapredpresent, _areatotal, and _predictionthreshold. Referenced by AreaStats(). Member Data Documentation int AreaStats::_areaNotPredicted [private] Definition at line 110 of file AreaStats.hh. Referenced by addnonprediction(), and reset().int AreaStats::_areaPredAbsent [private] Definition at line 109 of file AreaStats.hh. Referenced by addprediction(), and reset().int AreaStats::_areaPredPresent [private] Definition at line 108 of file AreaStats.hh. Referenced by addprediction(), getconfiguration(), and reset().int AreaStats::_areaTotal [private] Definition at line 107 of file AreaStats.hh. 15
117 Referenced by addnonprediction(), addprediction(), getconfiguration(), and reset().scalar AreaStats::_predictionThreshold [private] 16 Definition at line 112 of file AreaStats.hh. Referenced by addprediction(), getconfiguration(), and reset() 16
118 17 Annex 10 17
119 18 18

120 19 19
121 20 20
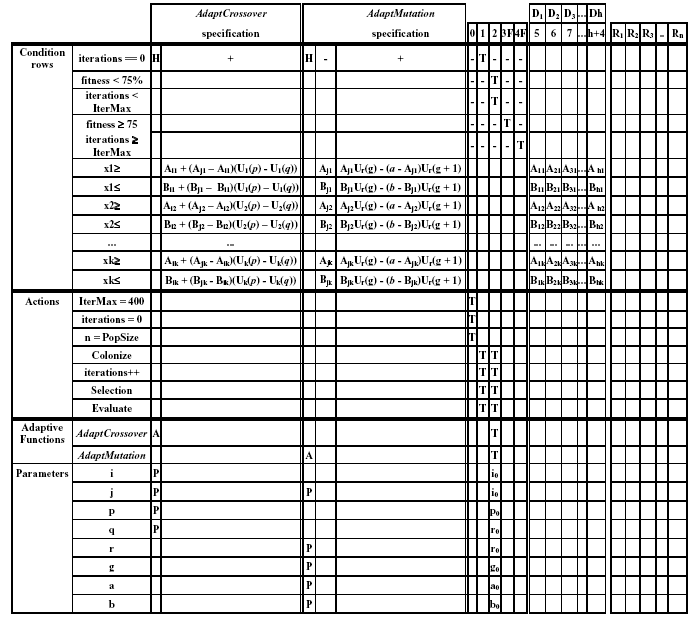
122 21 21
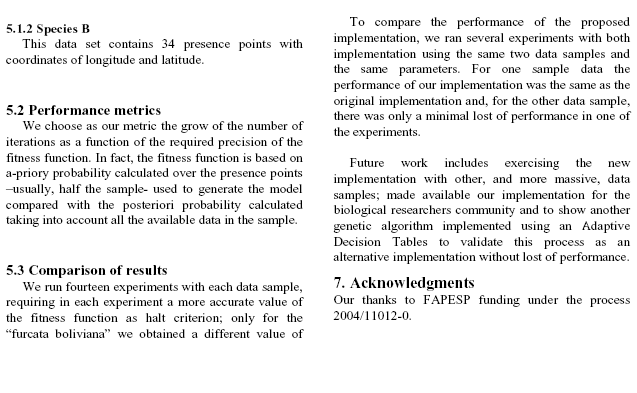
123 22 22
124 23 23
Digital Cartographic Generalization for Database of Cadastral Maps
 Mariane Alves Dal Santo marianedalsanto@udesc.br Francisco Henrique de Oliveira chicoliver@yahoo.com.br Carlos Loch cloch@ecv.ufsc.br Laboratório de Geoprocessamento GeoLab Universidade do Estado de Santa
Interoperability through Web Services: Evaluating OGC Standards in Client Development for Spatial Data Infrastructures
 GeoInfo - 2006 Interoperability through Web Services: Evaluating OGC Standards in Client Development for Spatial Data Infrastructures Leonardo Lacerda Alves Clodoveu A. Davis Jr. Information Systems Lab
Tese / Thesis Work Análise de desempenho de sistemas distribuídos de grande porte na plataforma Java
 Licenciatura em Engenharia Informática Degree in Computer Science Engineering Análise de desempenho de sistemas distribuídos de grande porte na plataforma Java Performance analysis of large distributed
Project Management Activities
 Id Name Duração Início Término Predecessoras 1 Project Management Activities 36 dias Sex 05/10/12 Sex 23/11/12 2 Plan the Project 36 dias Sex 05/10/12 Sex 23/11/12 3 Define the work 15 dias Sex 05/10/12
Scientific data repositories: the USP experience
 Scientific data repositories: the USP experience Superintendência de Tecnologia da Informação 2018 : Sylvio Canuto Antonio Mauro Saraiva Superintendência de TI: João Eduardo Ferreira Fátima L. S. Nunes
Easy Linux! FUNAMBOL FOR IPBRICK MANUAL. IPortalMais: a «brainware» company www.iportalmais.pt. Manual
 IPortalMais: a «brainware» company FUNAMBOL FOR IPBRICK MANUAL Easy Linux! Title: Subject: Client: Reference: Funambol Client for Mozilla Thunderbird Doc.: Jose Lopes Author: N/Ref.: Date: 2009-04-17 Rev.:
A Cloud Computing Architecture for Large Scale Video Data Processing
 Marcello de Lima Azambuja A Cloud Computing Architecture for Large Scale Video Data Processing Dissertação de Mestrado Dissertation presented to the Postgraduate Program in Informatics of the Departamento
Accessing the contents of the Moodle Acessando o conteúdo do Moodle
 Accessing the contents of the Moodle Acessando o conteúdo do Moodle So that all the available files in the Moodle can be opened without problems, we recommend some software that will have to be installed
User Guide Manual de Utilizador
 2400 DPI OPTICAL GAMING MOUSE User Guide Manual de Utilizador 2014 1Life Simplify it All rights reserved. www.1-life.eu 2 2400 DPI OPTICAL GAMING MOUSE ENGLISH USER GUIDE...4 MANUAL DE UTILIZADOR PORTUGUÊS...18
Serviços: API REST. URL - Recurso
 Serviços: API REST URL - Recurso URLs reflectem recursos Cada entidade principal deve corresponder a um recurso Cada recurso deve ter um único URL Os URLs referem em geral substantivos URLs podem reflectir
Efficient Locally Trackable Deduplication in Replicated Systems. www.gsd.inesc-id.pt. technology from seed
 Efficient Locally Trackable Deduplication in Replicated Systems João Barreto and Paulo Ferreira Distributed Systems Group INESC-ID/Technical University Lisbon, Portugal www.gsd.inesc-id.pt Bandwidth remains
Wiki::Score A Collaborative Environment For Music Transcription And Publishing
 Wiki::Score A Collaborative Environment For Music Transcription And Publishing J.J. Almeida 1 N.R. Carvalho 1 J.N. Oliveira 1 1 Department of Informatics, University of Minho {jj,narcarvalho,jno}@di.uminho.pt
Métodos Formais em Engenharia de Software. VDMToolTutorial
 Métodos Formais em Engenharia de Software VDMToolTutorial Ana Paiva apaiva@fe.up.pt www.fe.up.pt/~apaiva Agenda Install Start Create a project Write a specification Add a file to a project Check syntax
NORMAS PARA AUTORES. As normas a seguir descritas não dispensam a leitura do Regulamento da Revista Portuguesa de Marketing, disponível em www.rpm.pt.
 NORMAS PARA AUTORES As normas a seguir descritas não dispensam a leitura do Regulamento da Revista Portuguesa de Marketing, disponível em www.rpm.pt. COPYRIGHT Um artigo submetido à Revista Portuguesa
Software product lines. Paulo Borba Informatics Center Federal University of Pernambuco
 Software product lines Paulo Borba Informatics Center Federal University of Pernambuco Software product lines basic concepts Paulo Borba Informatics Center Federal University of Pernambuco Um produto www.usm.maine.edu
User interface evaluation experiences: A brief comparison between usability and communicability testing
 User interface evaluation experiences: A brief comparison between usability and communicability testing Kern, Bryan; B.S.; The State University of New York at Oswego kern@oswego.edu Tavares, Tatiana; PhD;
Heterogeneous multi-core computer architectures and
 Heterogeneous multi-core computer architectures and Dedicated processing structures for Signal processing applications Nuno Roma Ongoing research! Heterogeneous any-core processing!
VGM. VGM information. ALIANÇA VGM WEB PORTAL USER GUIDE June 2016
 Overview The Aliança VGM Web portal is an application that enables you to submit VGM information directly to Aliança via our e-portal Web page. You can choose to enter VGM information directly, or to download
Participatory Map of Rio de Janeiro
 Leandro Gomes Souza Geographer Luiz Roberto Arueira da Silva Director of City Information Pereira Passos Institute - City of Rio de Janeiro About us Pereira Passos Institute (IPP) is Rio de Janeiro municipal
Easy Linux! FUNAMBOL FOR IPBRICK MANUAL. IPortalMais: a «brainmoziware» company www.iportalmais.pt. Manual Jose Lopes
 IPortalMais: a «brainmoziware» company www.iportalmais.pt FUNAMBOL FOR IPBRICK MANUAL Easy Linux! Title: Subject: Client: Reference: Funambol Client for Microsoft Outlook Doc.: Author: N/Ref.: Date: 2009-04-17
Software Testing with Visual Studio 2013 (20497)
") Software Testing with Visual Studio 2013 (20497) Formato do curso: Presencial Preço: 800 Nível: Intermédio Duração: 12 horas Este curso, mostra a Programadores e Testers como utilizar as ferramentas do
Software Testing with Visual Studio 2013 (20497) Formato do curso: Presencial Preço: 800 Nível: Intermédio Duração: 12 horas Este curso, mostra a Programadores e Testers como utilizar as ferramentas do
Select a single or a group of files in Windows File Explorer, right-click and select Panther Print
 Quick Start Guide SDI Panther Print Panther Print SDI Panther products make sharing information easier. Panther Print is an intuitive dialog box that provides a thumbnail view of the file to print, depicting
A Tool to Evaluate Stuck-Open Faults in CMOS Logic Gates
 FURG A Tool to Evaluate Stuck-Open Faults in CMOS Logic Gates Alexandra L. Zimpeck, Cristina Meinhardt e Paulo F. Butzen Summary Introduction Motivation Stuck-Open Faults Stuck-Open Faults in Nanometer
OVERVIEW DO EAMS. Enterprise Architecture Management System 2.0
 OVERVIEW DO EAMS Enterprise Architecture Management System 2.0 NETWORKS @arqcorp_br #eamsrio http://arquiteturacorporativa.wordpress.com/ WE MANAGE KNOWLEDGE, WITH YOU Arquitetura Empresarial Repositório
UERJ Programa de Pós-graduação em Engenharia Mecânica (PPGEM) Seminary Class
 Seminary Class") UERJ Programa de Pós-graduação em Engenharia Mecânica (PPGEM) Seminary Class Simulation of energy performance of buildings: comparison of computational tools DOMUS and EnergyPlus. Mestrando: Paulo Roberto
UERJ Programa de Pós-graduação em Engenharia Mecânica (PPGEM) Seminary Class Simulation of energy performance of buildings: comparison of computational tools DOMUS and EnergyPlus. Mestrando: Paulo Roberto
Universidade da Beira Interior. Sistemas Distribuídos - 2014/2015 Curso: Engª Informática. Folha 11. JAX-RS: Java API for RESTful Web Services
 JAX-RS: Java API for RESTful Web Services A - Creating RESTful Web Services from a Database 1- Comece por criar um projeto do tipo Java Web application, como fez nos exercícios das fichas anteriores. No
Normalização e interoperabilidade da informação geográfica
 Normalização e interoperabilidade da informação geográfica perspetivas para a formação em Engenharia Geográfica João Catalão Departamento de Engenharia Geográfica, Geofísica e Energia Faculdade de Ciências
Versão: 1.0. Segue abaixo, os passos para o processo de publicação de artigos que envolvem as etapas de Usuário/Autor. Figura 1 Creating new user.
 Órgão: Ministry of Science, Technology and Innovation Documento: Flow and interaction between users of the system for submitting files to the periodicals RJO - Brazilian Journal of Ornithology Responsável:
Developing Microsoft SQL Server 2014 Databases (20464)
") Developing Microsoft SQL Server 2014 Databases (20464) Formato do curso: Presencial Localidade: Porto Com certificação: MCSE: Data Platform Data: 25 Set. 2017 a 29 Set. 2017 Preço: 1550 Horário: Laboral
Developing Microsoft SQL Server 2014 Databases (20464) Formato do curso: Presencial Localidade: Porto Com certificação: MCSE: Data Platform Data: 25 Set. 2017 a 29 Set. 2017 Preço: 1550 Horário: Laboral
CMDB no ITIL v3. Miguel Mira da Silva. mms@ist.utl.pt 919.671.425
 CMDB no ITIL v3 Miguel Mira da Silva mms@ist.utl.pt 919.671.425 1 CMDB v2 Configuration Management IT components and the services provided with them are known as CI (Configuration Items) Hardware, software,
BRIGHAM AND EHRHARDT PDF
 BRIGHAM AND EHRHARDT PDF ==> Download: BRIGHAM AND EHRHARDT PDF BRIGHAM AND EHRHARDT PDF - Are you searching for Brigham And Ehrhardt Books? Now, you will be happy that at this time Brigham And Ehrhardt
hdd enclosure caixa externa para disco rígido
 hdd enclosure caixa externa para disco rígido USER S GUIDE SPECIFICATONS HDD Support: SATA 2.5 Material: Aluminium and plastics Input connections: SATA HDD Output connections: USB 3.0 (up to 5.0Gbps)
Guião M. Descrição das actividades
 Proposta de Guião para uma Prova Grupo: Inovação Disciplina: Inglês, Nível de Continuação, 11.º ano Domínio de Referência: O Mundo do trabalho Duração da prova: 15 a 20 minutos 1.º MOMENTO Guião M Intervenientes
Programming in C# Conteúdo Programático. Área de formação Plataforma e Tecnologias de Informação
 Destinatários Programadores experientes com algum conhecimento de C, C++, JavaScript, Objective-C, Microsoft Visual Basic, ou Java e conheçam os conceitos de programação orientada por objetos. Nº mínimo
Erasmus Student Work Placement
 Erasmus Student Work Placement EMPLOYER INFORMATION Name of organisation Address Post code Country SPORT LISBOA E BENFICA AV. GENERAL NORTON DE MATOS, 1500-313 LISBOA PORTUGAL Telephone 21 721 95 09 Fax
5/10/10. Implementação. Building web Apps. Server vs. client side. How to create dynamic contents?" Client side" Server side"
 5/10/10 Implementação Mestrado em Informática Universidade do Minho! 6! Building web Apps How to create dynamic contents?" Client side" Code runs on the client (browser)" Code runs on a virtual machine
 USPTO No. 15143095 USPTO No. 15143095 USPTO No. 15143095 USPTO No. 15143095 USPTO No. 15143095 USPTO No. 15143095 USPTO No. 15143095 WORK PLAN FOR IMPLEMENTATION OF THE UNITED STATES PATENT AND
Welcome to Lesson A of Story Time for Portuguese
 Portuguese Lesson A Welcome to Lesson A of Story Time for Portuguese Story Time is a program designed for students who have already taken high school or college courses or students who have completed other
e-lab: a didactic interactive experiment An approach to the Boyle-Mariotte law
 Sérgio Leal a,b, João Paulo Leal a,c Horácio Fernandes d a Departamento de Química e Bioquímica, FCUL, Lisboa, Portugal b Escola Secundária com 3.º ciclo Padre António Vieira, Lisboa, Portugal c Unidade
Service quality in restaurants: an experimental analysis performed in Brazil
 . XIII INTERNATIONAL CONFERENCE ON INDUSTRIAL ENGINEERING AND OPERATIONS MANAGEMENT Energy that moves production: a dialogue among integration, project and sustainability 09-11 October 2007 Service quality
ESTRUTURA DE CAPITAL: UMA ANÁLISE EM EMPRESAS SEGURADORAS
 ESTRUTURA DE CAPITAL: UMA ANÁLISE EM EMPRESAS SEGURADORAS THE CAPITAL STRUCTURE: AN ANALYSE ON INSURANCE COMPANIES FREDERIKE MONIKA BUDINER METTE MARCO ANTÔNIO DOS SANTOS MARTINS PAULA FERNANDA BUTZEN
PREFEITURA MUNICIPAL DE BOM DESPACHO-MG PROCESSO SELETIVO SIMPLIFICADO - EDITAL
 CADERNO DE PROVAS 1 A prova terá a duração de duas horas, incluindo o tempo necessário para o preenchimento do gabarito. 2 Marque as respostas no caderno de provas, deixe para preencher o gabarito depois
Curso CP100A - Google Cloud Platform Fundamentals (8h)
") Curso CP100A - Google Cloud Platform Fundamentals (8h) Este curso virtual liderado por um instrutor, com 8 horas de duração, introduz os participantes aos produtos e serviços do Google Cloud Platform.
Curso CP100A - Google Cloud Platform Fundamentals (8h) Este curso virtual liderado por um instrutor, com 8 horas de duração, introduz os participantes aos produtos e serviços do Google Cloud Platform.
Lucas de Assis Soares, Luisa Nunes Ramaldes, Taciana Toledo de Almeida Albuquerque, Neyval Costa Reis Junior. São Paulo, 2013
 COMPARATIVE STUDY OF THE ATMOSPHERIC DISPERSION MODELS AND THROUGH THE ANALYSIS OF AIR QUALITY IN THE METROPOLITAN REGION OF GRANDE VITÓRIA Lucas de Assis Soares, Luisa Nunes Ramaldes, Taciana Toledo de
Sistemas Operativos - Mooshak. 1 Mooshak. in http://mooshak.deei. fct.ualg.pt/. mooshak.deei.fct.ualg.pt/.
 Sistemas Operativos - Mooshak 1 Mooshak O Mooshak (Leal and Silva, 2003) é um sistema para gerir concursos de programação. Para a sua utilização no âmbito da unidade curricular de Sistemas Operativos,
Information technology specialist (systems integration) Especialista em tecnologia da informação (integração de sistemas)
 Especialista em tecnologia da informação (integração de sistemas)") Information technology specialist (systems integration) Especialista em tecnologia da informação (integração de sistemas) Professional activities/tasks Design and produce complex ICT systems by integrating
Information technology specialist (systems integration) Especialista em tecnologia da informação (integração de sistemas) Professional activities/tasks Design and produce complex ICT systems by integrating
Online Collaborative Learning Design
 "Online Collaborative Learning Design" Course to be offered by Charlotte N. Lani Gunawardena, Ph.D. Regents Professor University of New Mexico, Albuquerque, New Mexico, USA July 7- August 14, 2014 Course
Vaporpunk - A fazenda-relógio (Portuguese Edition)
") Vaporpunk - A fazenda-relógio (Portuguese Edition) Octavio Aragão Click here if your download doesn"t start automatically Vaporpunk - A fazenda-relógio (Portuguese Edition) Octavio Aragão Vaporpunk - A
Vaporpunk - A fazenda-relógio (Portuguese Edition) Octavio Aragão Click here if your download doesn"t start automatically Vaporpunk - A fazenda-relógio (Portuguese Edition) Octavio Aragão Vaporpunk - A
MIT Portugal Program Engineering systems in action
 MIT Portugal Program Engineering systems in action Paulo Ferrão, MPP Director in Portugal Engineering Systems: Achievements and Challenges MIT, June 15-17, 2009 Our knowledge-creation model An Engineering
Software reliability analysis by considering fault dependency and debugging time lag Autores
 Campos extraídos diretamente Título Software reliability analysis by considering fault dependency and debugging time lag Autores Huang, Chin-Yu and Lin, Chu-Ti Ano de publicação 2006 Fonte de publicação
Designing Solutions for Microsoft SQL Server 2014 (20465)
") Designing Solutions for Microsoft SQL Server 2014 (20465) Formato do curso: Presencial Com certificação: MCSE: Data Platform Preço: 1090 Nível: Avançado Duração: 18 horas Este curso de 3 dias, destina-se
Designing Solutions for Microsoft SQL Server 2014 (20465) Formato do curso: Presencial Com certificação: MCSE: Data Platform Preço: 1090 Nível: Avançado Duração: 18 horas Este curso de 3 dias, destina-se
Ontology Building Process: The Wine Domain
 Ontology Building Process: The Wine Domain João Graça, Márcio Mourão, Orlando Anunciação, Pedro Monteiro, H. Sofia Pinto, and Virgílio Loureiro Summary Context Ontology Wine Domain Existing Wine Ontologies
Analysis, development and monitoring of business processes in Corporate environment
 Analysis, development and monitoring of business processes in Corporate environment SAFIRA is an IT consulting boutique known for transforming the way organizations do business, or fulfil their missions,
Protective circuitry, protective measures, building mains feed, lighting and intercom systems
 Tecnologia de instalações electrónicas Training systems / trainers for electrical wiring/building management systems: Protective circuitry, protective measures, building mains feed, lighting and intercom
ENGENHARIA DE SERVIÇOS SERVICES ENGINEERING
 Mestrado em Engenharia de Redes de Comunicações MSc in Communication Networks Engineering ENGENHARIA DE SERVIÇOS SERVICES ENGINEERING 2012-2013 Sistemas de Suporte às Operações 2 - Operations Support Systems
Princípios de Direito Previdenciário (Portuguese Edition)
") Princípios de Direito Previdenciário (Portuguese Edition) Wladimir Novaes. Martinez Click here if your download doesn"t start automatically Princípios de Direito Previdenciário (Portuguese Edition) Wladimir
Princípios de Direito Previdenciário (Portuguese Edition) Wladimir Novaes. Martinez Click here if your download doesn"t start automatically Princípios de Direito Previdenciário (Portuguese Edition) Wladimir
Using Big Data to build decision support tools in
 Using Big Data to build decision support tools in Agriculture Laboratory of Architecture Karen Langona and Computer Networks OSDC PIRE 2013 Edinburgh Workshop Climate and Agricultural Planning Agriculture
Implementing Data Models and Reports with SQL Server 2014 (20466)
") Implementing Data Models and Reports with SQL Server 2014 (20466) Formato do curso: Presencial Localidade: Lisboa Com certificação: MCSE: Business Intelligence Data: 11 Set. 2017 a 22 Set. 2017 Preço:
Implementing Data Models and Reports with SQL Server 2014 (20466) Formato do curso: Presencial Localidade: Lisboa Com certificação: MCSE: Business Intelligence Data: 11 Set. 2017 a 22 Set. 2017 Preço:
T Ã O B O M Q U A N T O N O V O
 D I S S E R T A Ç Ã O D E M E S T R A D O M A S T E R I N G D I S S E R T A T I O N A V A L I A Ç Ã O D A C O N D I Ç Ã O D E T Ã O B O M Q U A N T O N O V O U M A A P L I C A Ç Ã O E N V O L V E N D O
Da Emoção à Lesão: um Guia de Medicina Psicossomática (Portuguese Edition)
") Da Emoção à Lesão: um Guia de Medicina Psicossomática (Portuguese Edition) Geraldo José Ballone, Ida Vani Ortolani, Eurico Pereira Neto Click here if your download doesn"t start automatically Download
Da Emoção à Lesão: um Guia de Medicina Psicossomática (Portuguese Edition) Geraldo José Ballone, Ida Vani Ortolani, Eurico Pereira Neto Click here if your download doesn"t start automatically Download
2 Categorias Categories Todas as categorias de actividade são apresentadas neste espaço All activity categories are presented in this space
 1 Próximas Actividades Next Activities Visualiza as próximas actividades a ter inicio, com a indicação do tempo restante Displays upcoming activities and indicating the remaining time 2 Categorias Categories
Prova Oral de Inglês Duração da Prova: 20 a 25 minutos 2013/2014. 1.º Momento. 4 (A), are you a health-conscious person?
, are you a health-conscious person?") Prova Oral de Inglês Duração da Prova: 20 a 25 minutos 2013/2014 GUIÃO A Disciplina: Inglês, Nível de Continuação 11.º ano Domínio de Referência: O Mundo do Trabalho 1.º Momento Intervenientes e Tempos
Prova Oral de Inglês Duração da Prova: 20 a 25 minutos 2013/2014 GUIÃO A Disciplina: Inglês, Nível de Continuação 11.º ano Domínio de Referência: O Mundo do Trabalho 1.º Momento Intervenientes e Tempos
Implementing a Data Warehouse with Microsoft SQL Server 2014 (20463)
") Implementing a Data Warehouse with Microsoft SQL Server 2014 (20463) Formato do curso: Presencial Localidade: Porto Com certificação: MCSA: SQL Server Data: 16 Jan. 2017 a 20 Jan. 2017 Preço: 1550 Horário:
Implementing a Data Warehouse with Microsoft SQL Server 2014 (20463) Formato do curso: Presencial Localidade: Porto Com certificação: MCSA: SQL Server Data: 16 Jan. 2017 a 20 Jan. 2017 Preço: 1550 Horário:
Controle - 1. Monitorar e Controlar o Trabalho do Projeto Verificação do Escopo Controle do Escopo. Mauricio Lyra, PMP
 Controle - 1 Monitorar e Controlar o Trabalho do Projeto Verificação do Escopo Controle do Escopo 1 Processo de Monitoramento e Controle Concentra-se no monitoramento e na mensuração do desempenho do projeto
Uma solução possível para garantir, em ambiente APEX, a consistência duma estrutura ISA total e disjuntiva.
 Uma solução possível para garantir, em ambiente APEX, a consistência duma estrutura ISA total e disjuntiva. A possible solution to ensure, in APEX environment, the consistency of a total and disjunctive
Planejamento de comunicação integrada (Portuguese Edition)
") Planejamento de comunicação integrada (Portuguese Edition) Click here if your download doesn"t start automatically Planejamento de comunicação integrada (Portuguese Edition) Planejamento de comunicação
Planejamento de comunicação integrada (Portuguese Edition) Click here if your download doesn"t start automatically Planejamento de comunicação integrada (Portuguese Edition) Planejamento de comunicação
BR-EMS MORTALITY AND SUVIVORSHIP LIFE TABLES BRAZILIAN LIFE INSURANCE AND PENSIONS MARKET
 BR-EMS MORTALITY AND SUVIVORSHIP LIFE TABLES BRAZILIAN LIFE INSURANCE AND PENSIONS MARKET 2015 1 e-mail:mario@labma.ufrj.br Tables BR-EMS, mortality experience of the Brazilian Insurance Market, were constructed,
Geração automática de suíte de teste para GUI a partir de Rede de Petri
 Raquel Jauffret Guilhon Geração automática de suíte de teste para GUI a partir de Rede de Petri Dissertação de Mestrado Dissertação apresentada como requisito parcial para obtenção do grau de Mestre pelo
Neutron Reference Measurements to Petroleum Industry
 LABORATÓRIO NACIONAL DE METROLOGIA DAS RADIAÇÕES IONIZANTES IRD- Instituto de Radioproteção e Dosimetria Neutron Reference Measurements to Petroleum Industry Karla C. de Souza Patrão, Evaldo S. da Fonseca,
Cigré/Brasil. CE B5 Proteção e Automação. Seminário Interno de Preparação para o Colóquio do SC B5 2009
 Cigré/Brasil CE B5 Proteção e Automação Seminário Interno de Preparação para o Colóquio do SC B5 2009 Rio de Janeiro, 15-16 de setembro de 2009 Dados do Artigo Número: PS1 107 Título: Client Conformance
Informática e Programação. Computer Science and Programming. Semestre do plano de estudos 1
 Nome UC Informática e Programação CU Name Código UC 4 Curso LEC Semestre do plano de estudos 1 Área científica Informática Duração Semestral Horas de trabalho 135 ECTS 5 Horas de contacto TP - 67,5 Observações
Aqui pode escolher o Sistema operativo, e o software. Para falar, faça download do Cliente 2.
 TeamSpeak PORTUGUES ENGLISH Tutorial de registo num servidor de TeamSpeak Registration tutorial for a TeamSpeak server Feito por [WB ].::B*A*C*O::. membro de [WB ] War*Brothers - Non Dvcor Dvco Made by:
A dança do corpo vestido: Um estudo do desenvolvimento do figurino de balé clássico até o século XIX (Portuguese Edition)
") A dança do corpo vestido: Um estudo do desenvolvimento do figurino de balé clássico até o século XIX (Portuguese Edition) Francisca Dantas Mendes Click here if your download doesn"t start automatically
A dança do corpo vestido: Um estudo do desenvolvimento do figurino de balé clássico até o século XIX (Portuguese Edition) Francisca Dantas Mendes Click here if your download doesn"t start automatically
Para iniciar um agente SNMP, usamos o comando snmpd. Por padrão, aceita requisições na porta 161 (UDP).
.") EN3610 Gerenciamento e interoperabilidade de redes Prof. João Henrique Kleinschmidt Prática SNMP 1 MIBs RMON No Linux os arquivos MIB são armazenados no diretório /usr/share/snmp/mibs. Cada arquivo MIB
EN3610 Gerenciamento e interoperabilidade de redes Prof. João Henrique Kleinschmidt Prática SNMP 1 MIBs RMON No Linux os arquivos MIB são armazenados no diretório /usr/share/snmp/mibs. Cada arquivo MIB
GEO-C: OPEN SMART CITIES PLATFORM
 ZOOM SMART CITY LISBON 18-19 th MAY 2016 GEO-C: OPEN SMART CITIES PLATFORM Devanjan Bhattacharya, PhD Manager, Science & Technology, GEO-C NOVA IMS dbhattacharya@novaims.unl.pt PROJECT GEO-C GEO-C is funded
GUIÃO A. Ano: 9º Domínio de Referência: O Mundo do Trabalho. 1º Momento. Intervenientes e Tempos. Descrição das actividades
 Ano: 9º Domínio de Referência: O Mundo do Trabalho GUIÃO A 1º Momento Intervenientes e Tempos Descrição das actividades Good morning / afternoon / evening, A and B. For about three minutes, I would like
Course Computer Science Academic year 2012/2013 Subject Social Aspects of Computers ECTS 5
 Course Computer Science Academic year 2012/2013 Subject Social Aspects of Computers ECTS 5 Type of course Compulsory Year 2º Semester 2nd sem Student Workload: Professor(s) Natalia Gomes, Ascensão Maria
Pesquisa Qualitativa do Início ao Fim (Métodos de Pesquisa) (Portuguese Edition)
 (Portuguese Edition)") Pesquisa Qualitativa do Início ao Fim (Métodos de Pesquisa) (Portuguese Edition) Robert K. Yin Click here if your download doesn"t start automatically Pesquisa Qualitativa do Início ao Fim (Métodos de
Pesquisa Qualitativa do Início ao Fim (Métodos de Pesquisa) (Portuguese Edition) Robert K. Yin Click here if your download doesn"t start automatically Pesquisa Qualitativa do Início ao Fim (Métodos de
EIA and SEA differences and relationship
 Mestrado em Urbanismo e Ordenamento do Território/ Master in Urban Studies and Territorial Management Mestrado em Engenharia do Ambiente / Master in Environmental Engineering Avaliação Ambiental Estratégica
Análise Probabilística de Semântica Latente aplicada a sistemas de recomendação
 Diogo Silveira Mendonça Análise Probabilística de Semântica Latente aplicada a sistemas de recomendação Dissertação de Mestrado Dissertação apresentada como requisito parcial para obtenção do título de
Como testar componentes eletrônicos - volume 1 (Portuguese Edition)
") Como testar componentes eletrônicos - volume 1 (Portuguese Edition) Renato Paiotti Newton C. Braga Click here if your download doesn"t start automatically Como testar componentes eletrônicos - volume 1
Como testar componentes eletrônicos - volume 1 (Portuguese Edition) Renato Paiotti Newton C. Braga Click here if your download doesn"t start automatically Como testar componentes eletrônicos - volume 1
Vendors Enquiries for RFP 003/2015
 Date: 22/10/2015 Vendors Enquiries for RFP 003/2015 1) Question I am afraid the terms of the RFP cannot be complied by none of the companies we work with, the terms have limited the underwriters ability
CANape/vSignalyzer. Data Mining and Report Examples Offline Analysis V
 CANape/vSignalyzer Data Mining and Report Examples Offline Analysis V16.0 2018-07-30 Offline Evaluation Tools On-line Tools CANalyzer. Messages CANoe. Messages CANape. Signals Off-line Tools vsignalyzer
MASTER S DEGREE IN INTELLECTUAL PROPERTY ADMISSION EXAM
 CADERNO DE QUESTÕES NOTA FINAL MASTER S DEGREE IN INTELLECTUAL PROPERTY ADMISSION EXAM Before reading the text, pay attention to these important and essential remarks. All the answers must be written in
Para iniciar um agente SNMP, usamos o comando snmpd. Por padrão, aceita requisições na porta 161 (UDP).
.") EN3610 Gerenciamento e interoperabilidade de redes Prof. João Henrique Kleinschmidt Prática SNMP Net-SNMP (http://www.net-snmp.org) é um conjunto de aplicações usado para implementar SNMPv1, SNMPv2 e SNMPv3.
EN3610 Gerenciamento e interoperabilidade de redes Prof. João Henrique Kleinschmidt Prática SNMP Net-SNMP (http://www.net-snmp.org) é um conjunto de aplicações usado para implementar SNMPv1, SNMPv2 e SNMPv3.
Federal Court of Accounts Brazil (TCU) Auditing Climate Change Policies
 Auditing Climate Change Policies") Federal Court of Accounts Brazil (TCU) Auditing Climate Change Policies JUNNIUS MARQUES ARIFA Head of Department of Agriculture and Environmental Audit TCU s mandate and jurisdiction 1. Role of Supreme
Federal Court of Accounts Brazil (TCU) Auditing Climate Change Policies JUNNIUS MARQUES ARIFA Head of Department of Agriculture and Environmental Audit TCU s mandate and jurisdiction 1. Role of Supreme
Editorial Review. Users Review
 Download and Read Free Online Java SE 8 Programmer I: O guia para sua certificação Oracle Certified Associate (Portuguese Edition) By Guilherme Silveira, Mário Amaral Editorial Review Users Review From
Um olhar que cura: Terapia das doenças espirituais (Portuguese Edition)
") Um olhar que cura: Terapia das doenças espirituais (Portuguese Edition) Padre Paulo Ricardo Click here if your download doesn"t start automatically Um olhar que cura: Terapia das doenças espirituais (Portuguese
Um olhar que cura: Terapia das doenças espirituais (Portuguese Edition) Padre Paulo Ricardo Click here if your download doesn"t start automatically Um olhar que cura: Terapia das doenças espirituais (Portuguese
UNIDADE DE PESQUISA CLÍNICA Centro de Medicina Reprodutiva Dr Carlos Isaia Filho Ltda. SAMPLE SIZE DETERMINATION FOR CLINICAL RESEARCH
 SAMPLE SIZE DETERMINATION FOR CLINICAL RESEARCH Duolao Wang; Ameet Bakhai; Angelo Del Buono; Nicola Maffulli Muscle, Tendons and Ligaments Journal, 2013 Santiago A. Tobar L., Dsc. Why to determine the
manualdepsiquiatriainfant il manual de psiquiatria infantil
 manualdepsiquiatriainfant il manual de psiquiatria infantil These guides possess a lot information especially advanced tips such as the optimum settings configuration for manualdepsiquiatriainfantil manual
Addition of Fields in Line Item Display Report Output for TCode FBL1N/FBL5N
 Addition of Fields in Line Item Display Report Output for TCode FBL1N/FBL5N Applies to: Any business user who uses the transactions FBL1N and FBL5N to display line item reports for vendors and customers.
Solicitação de Mudança 01
 Solicitação de Mudança 01 Refatorar a especificação da linha de produtos Crisis Management System permitindo que o suporte ao registro de LOG seja opcional. Isso significa que o comportamento descrito
HMI Caracteristicas e extensões utilizando FT View ME v6.1 e PanelView Plus 6
 HMI Caracteristicas e extensões utilizando FT View ME v6.1 e PanelView Plus 6 Dangelo Ávila Gerente de Produto Email: dmavila@ra.rockwell.com Cel: (021) 98207-5700 PUBLIC PUBLIC - 5058-CO900H Agenda 1.
Engenharia de Requisitos. Professor: Dr. Eduardo Santana de Almeida Universidade Federal da Bahia esa@dcc.ufba.br
 Engenharia de Requisitos Professor: Dr. Eduardo Santana de Almeida Universidade Federal da Bahia esa@dcc.ufba.br O Documento de Requisitos Introdução The requirements for a system are the descriptions
Lucas Figueiredo Gonçalves
 Lucas Figueiredo Gonçalves Master s student in Computer Graphics at Federal University of Rio de Janeiro luccashappy@gmail.com Summary I m a Master s student in Computer Graphics at Federal University
Mestrado em Ciências Jurídicas Especialização em História do Direito 2015-16
 Mestrado em Ciências Jurídicas Especialização em História do Direito Unidade curricular História do Direito Português I (1º sem). Docente responsável e respectiva carga lectiva na unidade curricular Prof.
Implementing a Data Warehouse with Microsoft SQL Server 2014 (20463)
") Implementing a Data Warehouse with Microsoft SQL Server 2014 (20463) Formato do curso: Presencial e Live Training Com certificação: MCSA: SQL Server Preço: 1630 Nível: Avançado Duração: 35 horas Este curso
Implementing a Data Warehouse with Microsoft SQL Server 2014 (20463) Formato do curso: Presencial e Live Training Com certificação: MCSA: SQL Server Preço: 1630 Nível: Avançado Duração: 35 horas Este curso
Universidade do Minho. Escola de Engenharia. UC transversais Programas Doutorais 1º semestre 2012-13. 11 de outubro 2012
 Universidade do Minho Escola de Engenharia UC transversais Programas Doutorais 1º semestre 2012-13 11 de outubro 2012 1 2 2 courses offered in the first semestre: Métodos de Investigação em Engenharia
MT BOOKING SYSTEM BACKOFFICE. manual for management
 MT BOOKING SYSTEM BACKOFFICE manual for management BACKOFFICE BACKOFFICE Últimas Reservas Latest Bookings 8 7 6 3 2 2 Configurações Configuration - pag. 3 Barcos Boats - pag.8 Pessoal Staff - pag.0 Agentes